Figure 1. Spiral-wave solution and tip-trajectory
evolution for the "normal" guinea-pig ventricular model. (a) Isochrones
of the wavefront shown every 1ms. A total of 105 isochrones are plotted
(average rotation period is approximately 100ms throughout the simulation).
(b) Spatial voltage distribution (V -> z-axis)
snapshot. The numbers at the bottom of the plot indicate the V-level
contours and the asterisk the position of the spiral tip. (c) Tip trajectory
evolution for the "normal" guinea-pig ventricular model (standard parameter
values used see [5]). The region shown here is 5.5
× 5.5 mm2. The enlarged panel shows tip trajectory evolution
for 1100ms starting at t = 1900ms
to remove transients. Panels a-k show the same evolution in segments of
100ms. The horizontal solid bar in the enlarged and the first panel is
1mm wide. Mp4
movie of spiral-wave reentry in the guinea-pig ventricle model (white: excitation wave-front).
Figure 2. Spiral wave break-up in the
guinea-pig ventricular model. For this simulation P
Ca was
set to zero. The region with V
>= -10 mV is plot (black area) in
consecutive snapshots every 10 ms (left to right starting from the top).
Medium size is 20mm × 20 mm.
Mp4
movie of spiral-wave breakup in the
guinea-pig ventricle model (black: excited, white: excitable).
Sprouting.
Broken wave-fronts can give rise to spiral waves
if the excitability of the medium is high enough. Figure 3
shows the sprouting of a broken excitation wavefront in the normal GPV
medium. A plane wave is initiated by a supra-threshold stimulus at the
lower bottom of the medium. Before the wavefront reaches the middle of
the route to the top boundary the left 3/4 of the medium are set to resting
state. The broken wavefront tip thus produced sprouts to the left and bottom
of the medium while the rest part of the wavefront continues its propagation
towards the top. The solid line in the plots of Figure 3
denotes the V = -10 mV isoline while dashed one indicates the tip
trajectory (i.e. the intersection of V = -10 mV and
f = 0.5 isolines).
The wave-tip rapidly returns towards the refractory tail of the propagating
wave. Thus, theinitial tip-trajectory is almost linear with a direction
towards the bottom of the medium. The speed and direction of tip movement
should not be confused with the local propagation velocity and the evolution
of the wave-front line at different segments across its whole length that
depend on the local curvature. The latter varies and is different from
the curvature at the wavefront tip (critical curvature). After this phase,
the sprouting tip bypasses the refractory tail of the wavefront and returns
to excite the recovered region behind it. The plots in Figure 3
are shown every 5ms while the total simulation time is 55ms.
Figure 3. Sprouting of a broken excitation
wavefront for the standard guinea-pig ventricular model. The solid line
corresponds to the V = -10 mV isoline
and the dashed one to the tip trajectory (intersection of V = -10 mV
and f = 0.5 isolines). In the first
plot the cut excitation-wave is shown. This was obtained by stimulating
at the bottom of the medium and after the wavefront propagated for awhile
setting 3/4 of the left side of the medium to the resting state. Snapshots
are shown every 5ms (left to right starting from top left). The medium
size is 20mm × 60mm.
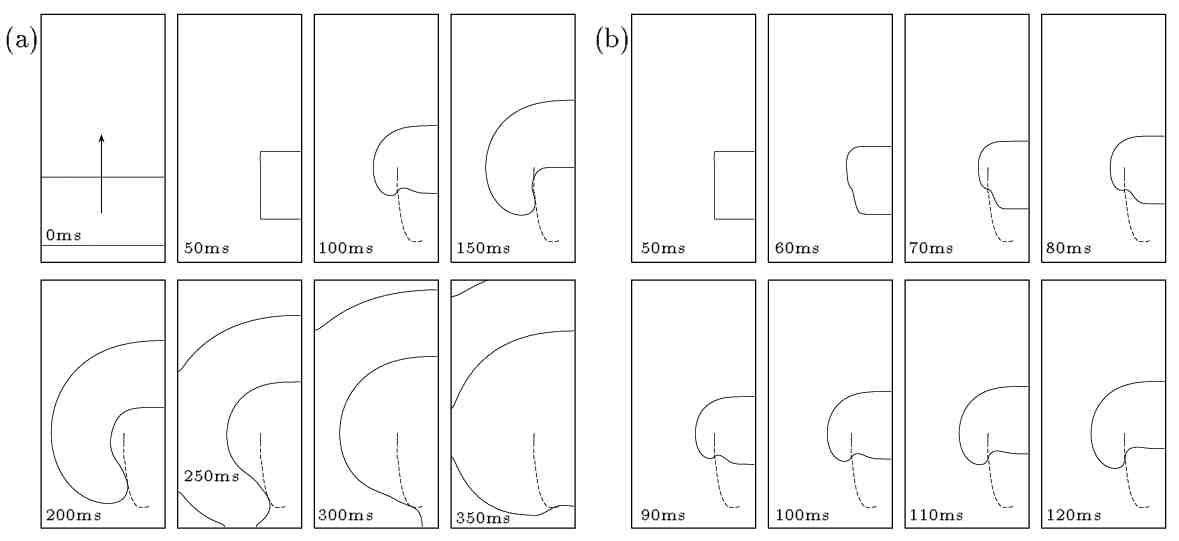
Figure 4. Sprouting of a broken excitation
wavefront for the guinea-pig ventricular model with low excitability (gNa = 0.3 mS).
The solid line corresponds to the V = -10 mV
isoline and the dashed one to the tip trajectory (intersection of V = -10 mV
and f = 0.5 isolines). In the second
frame of plot (a) the cut excitation-wave is shown. This was obtained by
stimulating at the bottom of the medium and after the wavefront propagated
for awhile setting 2/3 of the left side of the medium to the resting state.
Snapshots in (a) are shown every 50 ms (left to right starting from top
left). In plot (b) the same simulation is shown starting from the time
the wavefront was cut with successive frames shown every 10ms. The medium
size is 20 mm × 40 mm.
This sprouting scenario is altered if
the medium excitability is appropriately modified. In Figure 4
the same computational experiment is repeated for a guinea-pig ventricle
model for which the medium excitability is significantly reduced by setting
the sodium conductance gNato
0.3mS the standard value being 2.5 mS
(medium size: 20 mm×40 mm). Figure
4.a the broken wave produced by setting 2/3 of the
left side of the medium to the resting stateafter a propagating planar
wave has been initiated. The
V = -10 mV isoline (solid line) is plotted
every 50 ms with the dashed line representing the wave-tip evolution during
the simulation. Due to the low excitability local propagation of the wavefront
- including the wave-tip - is slower. The wave-tip trajectory is curved
while the speed of its movement is a lot slower than the propagation of
the wavefront. The refractory wave tail is not closely followed by the
wave-tip in this case. In Figure 4.b the initial
evolution of the broken excitation-wave is shown at smaller time intervals
(plots every 10 ms). This plot shows how the refractory part of the broken-end
of the wave slowly retracts while the excitatory part sprouts. The excitatory
and refractory portions of the broken end are separated by the point of
intersection of the wave-tip trajectory (dashed line) and the
V -isoline.
This was obtained by stimulating at the bottom of the medium and after
the wavefront propagated for awhile setting 2/4 of the left side of the
medium to the resting state. Snapshots in (a) are shown every 50 ms (left
to right starting from top left). In plot (b) the same simulation is shown
starting from the time the wavefront was cut with successive frames shown
every 10 ms.
Meandering
The dependenceof spiral-wave tip meandering patterns
on the conductance of the principal ionic currents and ion concentrations
is illustrated in the following simulations.
Transient outward conductance gto
The transient outward current, Ito
has been reported to occur in different cell types and it is mainly carried
by K+
ions. Its activation, inactivation and reactivation are voltage dependent.
In canine ventricular tissue Ito
is prominent in the epicardium but not in the endocardium. In the guinea-pig
ventricular cell model we manipulate
Ito
by modifying
gto i.e. the
maximum transient outward channel conductance. The behaviour of the model
for the standard gto value
(0.005 mS), double and half the standard
value and also
gto = 0 is shown
in Figure 5. The timeseries of V shown in
Figure 5(b) and (c) are obtained as "point-electrode"
recordings from an one-dimensional simulation during which the cable is
stimulated at one end. In (b) a single stimulus and in (c) repetitive stimuli
were applied. The meandering patterns shown in Figure 5(a)
show no significant differences between the normal meandering pattern (5.a.I)
and that obtained for the reduced (5.a.III) or blocked gto
meandering pattern. When gto
is increased from the standard value (5.a.IV) the
central core relatively reduced in size but a larger 5-lobe meandering
pattern is observed.
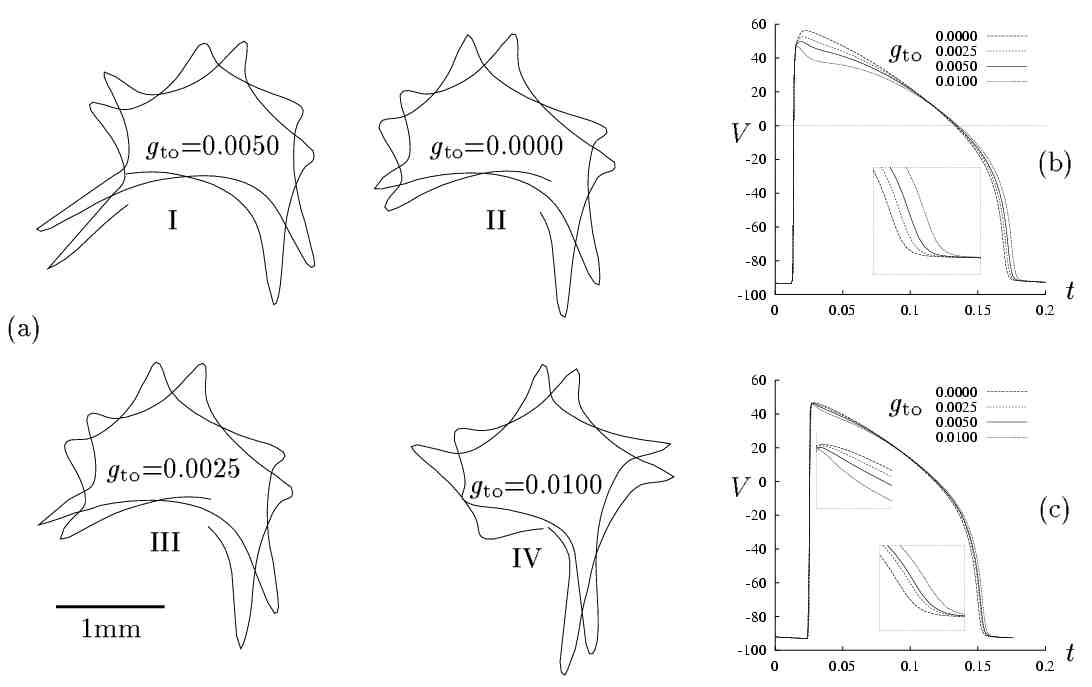
Figure 5. Effects of g
to on
spiral-wave meandering patterns. (a) Tip-trajectory evolution for different gto
values
during 220 ms. (a.I)gto= 0.0050
mS
is the value for the standard guinea-pig ventricle model, (a.II) gto
= 0.0 mS
-Ito is
blocked, (a.III) gto
= 0.0025 mS
- half the standard value, (a.IV) gto = 0.01 mS
- double the standard value. Action potential configurations with different
gto
values are shown superimposed for single (b) and repetitive
stimulation (c). The inset plots in (b) and (c) are magnifications of the
corresponding parts of the main plot. The gto
values
are given in the legend (t in s,
Vin
mV).
Sodium conductance gNa.
The sodium current is the dominant current during the rising phase of the
action potential and its amplitude affects the depolarisation rate (quantified
by the maximum dV/dt) and thus the conduction velocity of
activation wavefronts in cardiac tissue. The persistent inactivation of
INa
is responsible for the inexcitable spiral core around which spiral wave
rotation is organised in two dimensions. Moreover, it has been suggested
[6] that the interaction of INa
and ICa
wave fronts underlies the meandering patterns in models of mammalian ventricular
tissue.
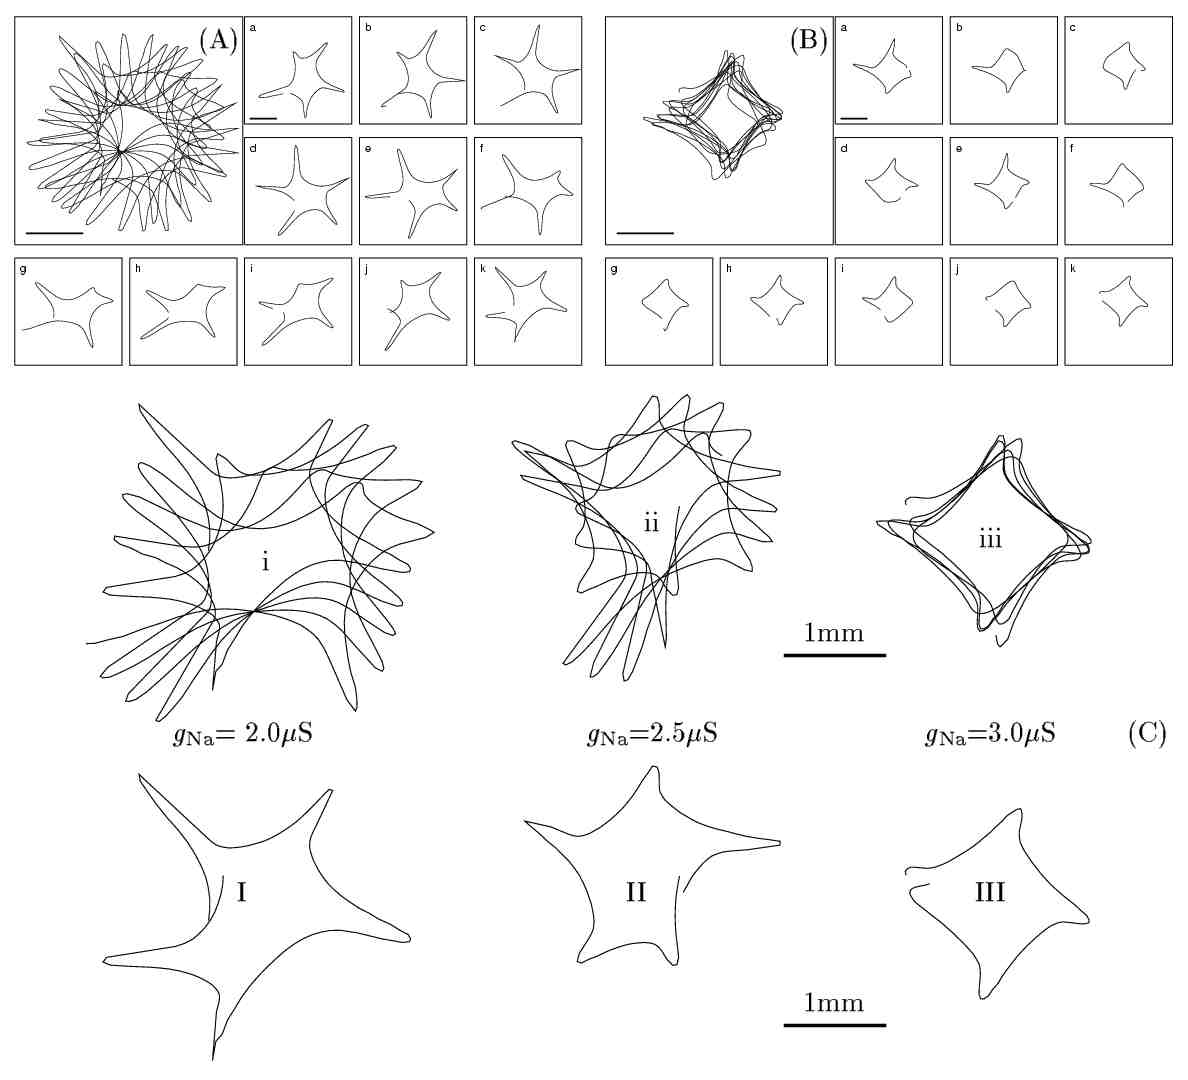
Figure 6. Effect of gNa on
meandering patterns. (C) Tip-trajectory evolution during 500 ms (i-iii)
and 110 ms (I-III). for different gNa values:
(C.i,I)gNa
= 2.0 mS,
(C.ii,II) gNa=2.5mS
- standard value for guinea-pig ventricular model, (C.iii,III)gNa=3.0mS.
The evolution of the spiral tip-trajectory is shown in (A) for gNa
= 2.0
mS and (B) for gNa
= 3.0 mS.
In the enlarged panel of (A) and (B) the total duration of tip-trajectory
evolution is 1100 ms corresponding to the interval 1400-2500 ms of simulation
in which a spiral was initiated using the phase distribution method. The
corresponding plots (a-k) show thesame simulation in successive 100 ms intervals.
The region shown here is 4.0 × 4.0 mm2.
The horizontal solid bars are 1 mm long.
Pathophysiological or pharmaceutical interventions
that alter the sodium conductance
gNawould
significantly affect the dynamics of spiral wave reentry in cardiac muscle.
Such effects are demonstrated in Figure 6 for the
guinea-pig ventricular model. Meandering patters of spiral wave tip for
the standard configuration are compared with the ones obtained with increased
and decreased gNa.
The reduction of gNa
(Figures 6 A, I and i) expands the region of sodium
current inactivation as the
INa
waves die earlier due to their decreased amplitude. In addition to the
increase of the meandering core the lobes of the pattern are longer. This
suggests that the region of functional block is invaded deeper, possibly
due to the slower
ICa
wave [6]. On the other hand, increasing
gNa
(Figures
6 B, III and iii) reduces the core size
and suppresses the 5-lobe pattern. An almost square core with four small
lobes emerges. In Figure 6.B the aging process of
the spiral core for increased gNa
is shown. It can be seen that the initially more pronounced 4-lobe meandering
pattern gets suppressed into an almost square trajectory. The increase
of gNa
strengthens the INa
wave and alters the dynamical interaction of INa
and
ICa
waves close to the spiral core. This results in decreasing the persistent
INa
inactivation region so that the slow
ICa
wave is not strong enough to bring the excitation wavefront deeper in the
refractory region.
Potassium conductance gK1.
The potassium current IK1
is activated during the falling phase of the action potential and contributes
to the repolarisation of cardiac tissue. Its modification would affect
the action potential duration by altering the repolarisation rate mainly
during the late repolarisation phase. Figures 7.b
and 7.c illustrate the effect of altering gK1
on the action potential for single and repetitive stimulation respectively.
Reducing
gK1
prolongs while increasing gK1shortens
action potential duration although
gK1
are less pronounced under repetitive stimulation. Meandering patterns obtained
by manipulating gK1
are shown in Figure 7.a. For low gK1
the normal 5-lobe meandering pattern is altered with the lobe size being
diminished around a central core of size comparable to the standard one.
This lobe-suppression effect is similar to but not the same as in the case
of increased gNa
(Figure 6). The increase of
gK1increases
the meandering region by extending the lobe length of the tip-trajectory
pattern.
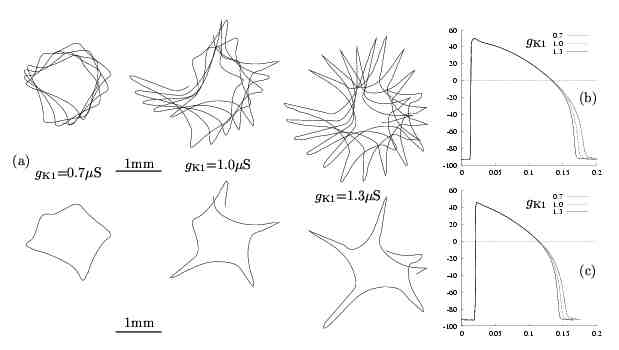
Figure 7. Effects of gK1on
spiral-wave meandering patterns. (a) Tip-trajectory evolution for different gK1
values during 500 ms (top) and 110 ms (bottom). The middle trajectory corresponds
to gK1 = 1.0 mS
which is the value for the standard guinea-pig ventricle model. Action
potential configurations with different gK1
values
are shown superimposed for single (b) and repetitive stimulation (c). The gK1
values (in mS)
are given in the legend (t in s,V in
mV).
Calcium conductance.
In the guinea-pig ventricular model the
magnitude of ICa
can be modulated via PCa,
the permeability of the slow inward calcium channel. Figure 8.c
shows the restitution curves for different values of PCa.
Action potential duration is normally increased with the increase of PCa.

Figure 8. Effects of altering PCaon
spiral-wave meandering. The evolution of the tip-trajectory is shown for
120 ms (a) and 600 ms (b). For the standard configuration (a.iv),(b.iv) PCa = 0.25 nA/mM
while for the other plots: (a.i),(b.i) PCa = 0.1 nA/mM,
(a.ii),(b.ii) PCa = 0.125 nA/mM,
(a.iii),(b.iii) PCa = 0.1875 nA/mM,
(a.v),(b.v) PCa = 0.3 nA/mM,
(a.vi),(b.vi) PCa = 0.35 nA/mM.
In plot (c) the corresponding restitution curves are shown. The horizontal
solid bar in (a) and (b) is 1mm long. The simulations were run in a 20 mm × 20 mm homogenous medium in which a counter-clockwise rotating spiral
was initiated.
Meandering patterns for different values
of PCa
are shown in Figure 8.a,b . The standard value for
PCa
is 0.25 nA/mM for which the 5-lobe meandering pattern is observed.
With PCareduced
to 0.1875 nA/mM (fig. 8.a.iii)
a 4-lobe meandering pattern with pronounced lobe length is obtained. This
4-lobe pattern has a striking property that can be visualised from Figure
8.b.iii:
it is a lot more stable than other meandering patterns as its shape is
not significantly changed or displaced with time. At lower values more
complex patterns are obtained with the core size being reduced in general.
As PCa
tends to zero irregularities in spiral wave activity are observed as the
spiral waveform changes with time and space. For values very close to zero
as one moves from the tip along the excitation wavefront the distance between
the excitation wavefront and the refractory tail varies with distance as
well as time. Such instabilities have been described for other models [8]
and seem to lead to spiral wave break up. Indeed for the guinea-pig ventricular
model PCa
seems to be a parameter that can lead to transition into irregular behaviour
as illustrated in section§3.2.
For increased PCa
a square-like meandering pattern is also obtained (fig. 8.b.v)
with a central core larger than that for reduced PCa
(fig. 8.b.iii) and the
four lobes of varying size with time but less pronounced than in fig. 8.b.iii.
With PCa
further increased (fig. 8.b.vi)
the spiral core becomes more elongated and lobe patters tend to get suppressed
both with time for a given PCa
value or with increasing PCa.
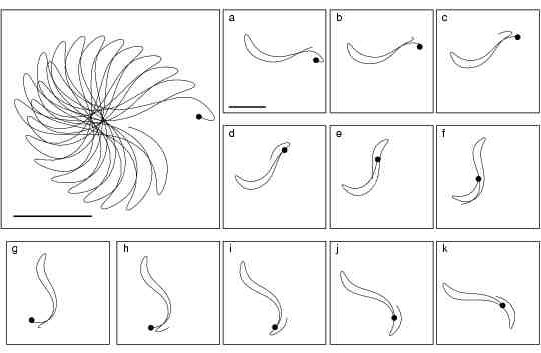
Figure 9. Meandering pattern for PCa = 0.5
(standard value is PCa = 0.25).
Plots a-k show tip-trajectory evolution during successive 150 ms intervals
while the enlarged plot shows the whole evolution from a to k. The starting
tip-trajectory point in each plot is marked by a filled circle. The horizontal
bars correspond to 5 mm and the plot size is 14 mm × 14 mm. The simulation
consisted of a counter-clockwise rotating spiral in a 30 mm × 30 mm
homogenous guinea-pig ventricular medium.
If
PCais
doubled from its standard value an almost linear core is obtained as it
can be seen from Figure
9. Plotted during one rotation
the tip-trajectory is reminiscent of that obtained for theFitzHugh-Nagumo
medium in [
9].
Conclusions
Calcium conductance blockade has been used in
[8] and was found to remove the extended conduction
blocks responsible for the onset of irregular activation patterns. On the
contrary calcium conductance blockade in the guinea-pig ventricular model
seems to be responsible for spiral wave break-up and the onset of irregular
activation patterns (see Figure 2). Most commonly
excitable media models support spiral waves that are stable in the sense
that asingle spiral wave-front exists emanating from the core. This single-spiral
might be rigidly rotating, meandering or drifting but its waveform is stable
[2, 4, 3].
Chudin et al [7] study excitation wave
propagation in cardiac tissue and the effects of intracellular calcium
dynamics using the modified Luo-Rudy model [10, 11,
12,
13]. They report irregular dynamical behaviour for
intracellular calcium in single-cell simulations with high frequency stimulation.
It is suggested that this behaviour underlies the transition from stationary
spiral-wave to the spiral-wave breakup regime. In their two dimensional
simulations (excitable medium model with modified Luo-Rudy kinetics implemented
ona parallel supercomputer CRAY-T3D) spiral waves degenerate to fibrillation
due to wave breakup. Using the single-cell results the authors propose
that the transition from the stationary to the non-stationary spiral wave
behaviour is due to the slow development of complex Ca2+
dynamics: the elevation of the internal Ca2+concentration
increases the action potential duration by amplifying the
Na+-Ca2+exchanger
current. This prolongation of APD shortens the diastolic interval and modifies
the character of propagation with a critical point being the abnormally
high Ca2+ release
from the sarcoplasmic reticulum [7]. This hypothesis
was tested through two dimensional simulations with the L-type Ca2+
channel blocked. The channel blockade produced stable spiral waves (no
breakup was observed) while if applied after initial breakup process it
could prevent the cascade of breakup and the degeneration of excitation
patterns into turbulent activity [7]. In the Oxsoft
®Heart
guinea-pig ventricular model ICa
we conducted two-dimensional simulations of spiral-wave activity for which
the parameter PCa
(calcium channel permeability) was varied over a wide range of parameter-values.
Increasing or decreasing PCais
correspondingly increasing or decreasing the flow of Ca2+
ions into the cell without affecting the passage of K+,
Na+ through the
Ca2+ channel.
In almost all simulations stable spiral wave activity was sustained although
the modification of PCa
significantly affected the spiral-wave tip meandering patterns. The spiral
wave breakup behaviour observed here is similar to that obtained by Chudin
et
al [7] but the mechanism producing this behaviour
in the two models seems to be quite opposite. In the simulations of Chudin
et
al [7] preventing calcium entry into the cells
through L-type Ca2+
channel blockade inhibited breakup while in our simulations preventing
calcium entry through the reduction of
PCa
favoured breakup.
References
[1] Beeler, G.W. and Reuter, H.,
"Reconstruction of the action potential of ventricular myocardial fibres",
Journal of Physiology, vol. 268, pp. 177-210, 1977.
[2] Biktashev, V.N. and Holden,
A.V., "Resonant drift of an autowave vortex in a bounded medium", Physics
Letters A, vol. 181, pp. 216-224, 1993.
[3] Biktashev, V.N.
and Holden, A.V., "Design principles of a low-voltage cardiac defibrillator
based on the effect of feedback resonant drift", Journal of Theoretical
Biology, vol. 169, pp. 101-112, 1994.
[4] Biktashev, V.N. and Holden, A.V., "Resonant
drift of autowave vortices in 2 dimensions and the effects of boundaries
and inhomogeneities", Chaos Solitons & Fractals, vol. 5, pp. 575-622,
1995.
[5] Biktashev, V.N. and Holden, A.V., "Re-entrant
activity and its control in a model of mammalian ventricular tissue", Proceedings
of the Royal Society of London Series B- Biological Sciences, vol. 263,
pp. 1373-1382, 1996.
[6] Biktashev, V.N. and Holden,
A.V., "Reentrant waves and their elimination in a model of mammalian ventricular
tissue", Chaos, vol. 8, pp. 48-56, 1998.
[7] Chudin, E., Garfinkel, A., Weiss,
J., Karplus, W. and Kogan, B., "Wave propagation in cardiac
tissue and effects of intracellular calcium dynamics (computer simulation
study)", Progress in Biophysics & Molecular Biology, vol. 69, pp. 225-236,
1998.
[8] Courtemanche, M. and Winfree,
A., "Re-entrant rotating waves in a beeler-reuter based model of two-dimensional
cardiac activity", International Journal of Bifurcations & Chaos, vol.
1, pp. 431-444, 1991.
[9] V. Krinsky, I. and Efimov, I.R.,
"Vortices with linear cores in mathematical-models of excitable media",
Physica A, vol. 188, pp. 55-60, 1992.
[10] Luo, C.H. and Rudy, Y., "A model
of the ventricular cardiac action-potential - depolarization, repolarization,
and their interaction", Circulation Research, vol. 68, pp. 1501-1526, 1991.
[11] Luo, C.H. and Rudy, Y., "A dynamic-model
of the cardiac ventricular action-potential - ionic currents and concentration
changes", Circulation, vol. 86, pp. 563, 1992.
[12] Luo, C.H. and Rudy, Y., "A dynamic-model
of the cardiac ventricular action-potential .1. simulations of ionic currents
and concentration changes", Circulation Research, vol. 74, pp. 1071-1096,
1994.
[13] Luo, C.H. and Rudy, Y., "A dynamic-model
of the cardiac ventricular action-potential .2 afterdepolarizations, triggered
activity, and potentiation", Circulation Research, vol. 74, pp. 1097-1113,
1994.
[14] Noble,
D., Noble, S.J., Bett, G.C.L., Earm, Y.E., Ho, W.K. and So, I.K., "The
role of sodium-calcium exchange during the cardiac action- potential",
Annals of the New York Academy of Sciences, vol. 639, pp. 334-353, 1991.
[15] Oxsoft. Oxsoft ®Heart.
Program manual - Version 4.4, 1994.

 Home
Current Issue
Table of Contents
Home
Current Issue
Table of Contents