|
International Journal of Bioelectromagnetism Vol. 6, No. 2, pp. 1-26, 2004. |
 |
 |
www.ijbem.org |
|
Estimating Causality among Cortical Areas of the L. Astolfia,b,
F. Cincottib, D. Mattiab, L. Dingc, B. Hec,
aDipartimento di Informatica e Sistemistica, Univ. "La Sapienza", Roma, Italia Correspondence: Laura Astolfi, IRCCS
Fondazione Santa Lucia, via Ardeatina 356, 00100, Roma, Italy.
Abstract.
The concept of brain connectivity plays a central role in the neuroscience
and different methodologies for the estimation of such connectivity have been
adopted in literature. This paper presents advanced methods for the estimation
of cortical connectivity by applying Structural Equation Modeling (SEM) and
Directed Transfer Function (DTF) on the cortical signals estimated from high
resolution EEG recordings. Before the application of SEM and DTF methodology
to the cortical waveforms estimated from high resolution EEG data in human,
we performed a simulation study, in which different main factors (signal to
noise ratio, SNR, and simulated cortical activity duration, LENGTH) were
systematically manipulated in the generation of test signals, and the
errors in the estimated connectivity were evaluated by the Analysis of
Variance (ANOVA). The statistical analysis returned that during simulations,
both SEM and DTF estimators were able to correctly estimate the imposed
connectivity patterns under reasonable operative conditions, i.e. when
data exhibit a SNR of at least 3 and a LENGTH of at least 75 seconds of
non-consecutive EEG recordings at 64 Hz of sampling rate. Determination
of the priors in the resolution of the linear inverse problem was performed
with the use of information from the hemodynamic responses of the cortical
areas as revealed by block-designed fMRI. These methods were evaluated
in human experimental EEG and fMRI data recorded in separate sessions.
Keywords: Structural Equation Modeling, Directed Transfer Function, High resolution EEG, fMRI, connectivity.
1. Introduction Human neocortical processes involve temporal and spatial scales spanning several orders of magnitude, from the rapidly shifting somatosensory processes characterized by a temporal scale of milliseconds and a spatial scale of few square millimeters to the memory processes, involving time periods of seconds and spatial scale of square centimeters. Information about the brain activity can be obtained by measuring different physical variables arising from the brain processes, such as the increase in consumption of oxygen by the neural tissues or a variation of the electric potential over the scalp surface. All these variables are connected in direct or indirect way to the neural ongoing processes, and each variable has its own spatial and temporal resolution. The different neuroimaging techniques are then confined to the spatio-temporal resolution offered by the monitored variables. For instance, it is known from physiology that the temporal resolution of the hemodynamic deoxyhemoglobin increase/decrease lies in the range of 1-2 seconds, while its spatial resolution is generally observable with the current imaging techniques at few mm scale. Today, there is not a single neuroimaging method which allows a spatial resolution on a mm scale and a temporal resolution on a msec scale. Hence, it is of interest to study the possibility to integrate the information offered by the different physiological variables in a unique mathematical context. This operation is called the "multimodal integration" of variable X and Y, when the X variable has typically particular appealing spatial resolution property (mm scale) and the Y variable has particular attractive temporal properties (on a ms scale). Nevertheless, the issue of several temporal and spatial domains is critical in the study of the brain functions, since different properties could become observable, depending on the spatio-temporal scales at which the brain processes are measured. Electroencephalography (EEG) and magnetoencephalography (MEG) are two interesting techniques that present a high temporal resolution, on the millisecond scale, adequate to follow brain activity. Unlikely, both techniques have a relatively modest spatial resolution, beyond the centimeter. Being fundamentally limited by the inter-sensor distances and by the fundamental laws of electromagnetism [Nunez, 1981]. On the other hand, the use of a priori information from other neuroimaging techniques like functional magnetic resonance imaging (fMRI) with high spatial resolution could improve the localization of sources from EEG/MEG data. The rationale of the multimodal approach based on fMRI, MEG and EEG data to locate brain activity is that neural activity generating EEG potentials or MEG fields increases glucose and oxygen demands [Magistretti et al., 1999]. This results in an increase in the local hemodynamic response that can be measured by fMRI [Grinvald et al., 1986, Puce et al., 1997]. On the whole, such a correlation between electrical and hemodynamic concomitants provides the basis for a spatial correspondence between fMRI responses and EEG/MEG source activity. However, static images of brain regions activated during particular tasks do not convey the information of how these regions communicate to each other. The concept of brain connectivity is viewed as central for the understanding of the organized behavior of cortical regions beyond the simple mapping of their activity [Lee et al., 2003, Horwitz, 2003]. This organization is thought to be based on the interaction between different and differently specialized cortical sites. Cortical connectivity estimation aims at describing these interactions as connectivity patterns which hold the direction and strength of the information flow between cortical areas. To achieve this, several methods have been already applied on data gathered from both hemodynamic and electromagnetic techniques [Buchel and Friston, 1997, Gevins et al., 1989, Urbano et al., 1998, Brovelli et al., 2002, Taniguchi et al., 2000]. Two main definitions of brain connectivity have been proposed along these years: functional and effective connectivity [Friston, 1994]. While functional connectivity is defined as temporal correlation between spatially remote neurophysiologic events, the effective connectivity is defined as the simplest brain circuit which would produce the same temporal relationship as observed experimentally between cortical sites. As for the functional connectivity, the several computational methods proposed to estimate how different brain areas are working together typically involve the estimation of some covariance properties between the different time series measured from the different spatial sites during motor and cognitive tasks studied by EEG and fMRI techniques [Gerloff et al., 1998, Gevins et al., 1989, Jancke et al., 2000, Urbano et al., 1998]. Differently, Structural Equation Modeling (SEM) is a technique that has been used for a decade to assess effective connectivity between cortical areas in humans by using hemodynamic and metabolic measurements [Bollen, 1989, Schlosser et al., 2003, Buchel and Friston, 1997, McIntosh and Gonzalez-Lima, 1994]. The basic idea of SEM differs from the usual statistical approach of modeling individual observations, since SEM considers the covariance structure of the data [Bollen, 1989]. However, the estimation of cortical effective connectivity obtained with the application of the SEM technique on fMRI data has a low temporal resolution (on the order of ten seconds) which is far from the time scale at which the brain operates normally. Hence, it is of interest to understand if the SEM technique could be applied to cortical activity estimated by applying the linear inverse techniques to the high resolution EEG data [Gevins et al., 1989, Nunez, 1995, Babiloni et al., 2000, Babiloni et al., 2003, He et al., 2001, 2002a, 2002b, 2002c, He & Lian, 2002, Hori et al., 2004]. In this way, it would be possible to study time-varying patterns of brain connectivity, linked to the different parts of the experimental task studied. So far, the estimation of functional connectivity on EEG signals has been addressed by applying either linear and non-linear methods which can both disclose the direct flow of information between scalp electrodes in the time domain, although with different computational demanding [Nunez, 1995, Clifford Carter, 1987, Gevins et al., 1989, Urbano et al., 1998, Inouye et al., 1995, Stam, 2002, Stam et al., 2003, Tononi et al., 1994, Quian Quiroga et al., 2002]. In addition, due to the evidence that important information in the EEG signals are often coded in the frequency rather than time domain (reviewed in [Pfurtscheller and Lopes da Silva, 1999]), attention has been focused on detecting frequency-specific interactions in EEG or MEG signals by analyzing the coherence between the activity of pairs of structures [Bressler, 1995, Gross et al., 2001, Gross et al., 2003]. However, coherence analysis just examines whether a link exists between two neural structures, by describing instances when they are in synchronous activity, and it does not provide directly the direction of the information flow. In this respect, a multivariate spectral technique called Directed Transfer Function (DTF) was proposed [Kaminski and Blinowska, 1991] to determine the directional influences between any given pair of channels in a multivariate data set. This estimator is able to characterize at the same time direction and spectral properties of the brain signals, requiring only one multivariate autoregressive (MVAR) model to be estimated from all the EEG channel recordings. The DTF technique has been recently demonstrated [Kaminski et al., 2001] to rely on the key concept of Granger causality between time series [Granger C.W.J., 1969], according to which an observed time series x(n) causes another series y(n) if the knowledge of x(n)'s past significantly improves prediction of y(n); this relation between time series is not reciprocal, i.e. x(n) may cause y(n) without y(n) necessarily causing x(n). This lack of reciprocity allows the evaluation of the direction of information flow between structures In this paper we review the cortical connectivity patterns by exploiting the SEM and DTF techniques applied on high resolution EEG signals which exhibit a higher spatial resolution than conventional cerebral electromagnetic measures. Recently, such techniques were successfully applied on high resolution EEG measurements [Babiloni et al., 2005a] and their properties were also investigated through simulation studies [Astolfi et al., 2005a,b,c]. Indeed, this kind of EEG techniques includes the use of a large number of scalp electrodes, realistic geometry models of the head derived from structural magnetic resonance images (MRIs), and advanced processing methodologies related to the solution of the linear inverse problem. These methodologies allow the estimation of cortical current density from sensor measurements [Grave de Peralta Menendez, 1999, Pascual-Marqui, 1995, Babiloni et al., 2000, He et al., 2002°, Hori et al., 2004]. To summarize the studies already performed, we first review the behavior of the SEM and DTF methods in a simulation context, under different conditions that affects the EEG recordings, mainly the signal to noise ratio (factor SNR) and the length of the recordings (factor LENGTH) [Astolfi et al., 2005a,b]. In particular, the following questions were addressed: a) what is the influence of a variable SNR level imposed on the high resolution EEG data on the accuracy of the pattern connectivity estimation obtained by SEM and DTF? b) what is the amount of high resolution EEG data necessary to get a usable accuracy of the estimation of connectivity between cortical areas? Subsequently, both SEM and DTF methods were applied to the cortical estimates obtained from high resolution EEG data related to a simple finger tapping experiment in a group of human subjects, in order to evaluate the capability of the proposed methodology to draw patterns of cortical connectivity between brain areas during a simple motor task. Finally, we also present both the mathematical principle and the practical applications of the multimodal integration of high resolution EEG and fMRI for the localization of sources responsible for intentional movements.
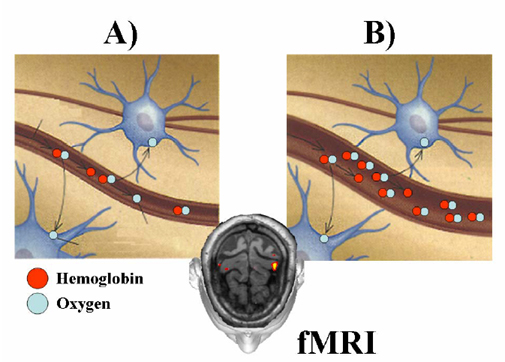
2. Material and Methods 2.1. Monitoring the cerebral hemodynamic response by fMRI A brain imaging method, known as functional magnetic resonance imaging (fMRI), has gained favor among neuroscientists over the last several years. Functional MRI reflects oxygen consumption and, as oxygen consumption is tied to processing or neural activation, can give a map of functional activity. When neurons fire, they consume oxygen and this causes the local oxygen levels to briefly decrease and then actually increase above the resting level as nearby capillaries dilate to let more oxygenated blood flow into the active area. The most used acquisition paradigm is the so-called Blood Oxygen Level Dependence (BOLD), in which the fMRI scanner works by imaging blood oxygenation. The BOLD paradigm relies on the brain mechanisms, which overcompensate for oxygen usage (activation causes an influx of oxygenated blood in excess of that used and therefore the local oxyhemoglobin concentration increases). Oxygen is carried to the brain in the hemoglobin molecules of blood red cells. Figure 1 shows the physiologic principle at the base of the generation of fMRI signals. In this figure it is shown how the hemodynamic responses elicited by an increased neuronal activity (A) produces a decrease of the deoxyhemoglobin content of the blood flow in the same neuronal district after few seconds (B).The magnetic properties of hemoglobin differ when it is saturated with oxygen compared to when it has given up oxygen. Technically, deoxygenated hemoglobin is "paramagnetic" and therefore has a short T2 relaxation time. As the ratio of oxygenated to deoxygenated hemoglobin increases, so does the signal recorded by the MRI. Deoxyhemoglobin increases the rate of depolarization of hydrogen nuclei creating the MR signal thus decreases the intensity of the T2 image. The bottom line is that the intensity of images increases with the increase of brain activation. The problem is that at the standard intensity used for the static magnetic field (1.5 Tesla) this increase is small (usually less than 2%) and easily obscured by noise and different artifacts. By increasing the static field of the fMRI scanner, the signal to noise ratio increases to more convenient values. Static field values of 3 Tesla are now commonly used for research on humans, while recently fMRI scanner at 7 Tesla was employed to map hemodynamic responses in the human brain [Bonmassar et al., 2001]. At such high field value, the possibility to detect the initial increase of deoxyhemoglobin (the initial "dip") increase. The interest in the detection of the dip is based on the fact that this hemodynamic response happens on timescale of 500 ms (as revealed by hemodynamic optic measures; [Malonek and Grinvald, 1996]), compared to 1-2 seconds needed for the response of the vascular system to the oxygen demand. Furthermore, in the latter case the response has a temporal extension well beyond the activation occurred (10 seconds). As a last point, the spatial distribution of the initial dip (as described by using the optical dyes; [Malonek and Grinvald, 1996]) is sharper than those related to the vascular response of the oxygenated hemoglobin. Recently, with high field strength MR scanners at 7 or even 9.4 Tesla a resolution down to cortical column level has been achieved [Kim et al., 2000]. However, at the standard field intensity commonly used in fMRI studies (1.5 or 3 Tesla), the identification of such initial transient increase of deoxyhemoglobin is controversial. Figure 1. The figure shows the physiologic principle at the base of the generation of fMRI signals. A) Neurons increase their firing rates, increasing also the oxygen consumption. B) Hemodynamic response in a second scale increases the diameter of the vessel close to the activated neurons. The induced increase in blood flow overcomes the need for oxygen supply. As a consequence, the percentage of deoxyhemoglobin in the blood flow decreases in the vessel with respect to the figure A).
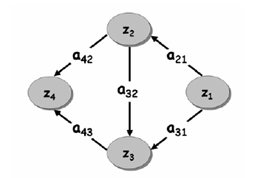
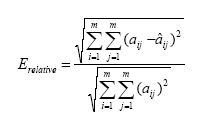
2.2. Estimating the causal dependence between EEG signals with Structural Equation Modeling and Directed Transfer Function Recently, we proposed the use of the Structural Equation Modeling (SEM) and Directed Transfer Function (DTF) for the analysis of the estimated cortical signals, by testing their properties through a simulation study before and then by applying such connectivity tools to real EEG data [Astolfi et al., 2005a,b,c; Babiloni et al., 2005a]. Here, we review the two methods to assess causal relationships between EEG recorded signals. In the SEM the parameters are estimated by minimizing the difference between the observed covariances and those implied by a structural or path model. In terms of neural systems, a measure of covariance represents the degree to which the activities of two or more regions are related. The SEM consists of a set of linear structural equations containing observed variables and parameters defining causal relationships among the variables. Variables in the equation system can be endogenous (i.e. dependent from the other variables in the model) or exogenous (independent from the model itself). The structural equation model specifies the causal relationship among the variables, describes the causal effects and assigns the explained and the unexplained variance [Bollen, 1989]. The public available software LISREL [Jöreskog and Sörbom, 2002] was used for the implementation of the SEM technique. The DTF technique was applied to the set of cortical estimated waveforms obtained for the N ROIs considered, as will be described in details in the paragraph of the linear inverse estimation. The equations employed can be found in [Kaminski and Blinowska, 1991]. 2.3. Computer Simulation The Simulation Study The experimental design we adopted was meant to analyze the recovery of the connectivity pattern under different levels of SNR and signal temporal length, as they have been imposed during the generation of sets of test signals, simulating cortical average activations. The simulated signals were obtained, as described below, starting from actual cortical data, estimated with the high resolution EEG procedures already available at the High Resolution EEG Laboratory of the University of Rome "La Sapienza". Signal Generation for the SEM methodologyDifferent sets of test signals have been generated in order to fit an imposed connectivity pattern (shown in Fig. 2) and to respect imposed levels of temporal duration (LENGTH) and Signal to Noise Ratio (SNR). In the following, in order to use a more compact notation, signals have been represented with the z vector containing both the endogenous and the exogenous variables. Channel z1 is a reference source waveform, estimated from a high resolution EEG (128 electrodes) recording in a healthy subject, during the execution of unaimed self-paced movements of the right finger. Signals z2, z3 and z4 were obtained by contribution of signals from all other channels, with an amplitude variation, plus zero mean uncorrelated white noise processes with appropriate variances. Figure 2. Connectivity pattern imposed in the generation of simulated signals. z1, , z4 represent the average activities in four cortical areas. Values on the arcs represent the connections strength (a21=1.4, a31=1.1, a32=0.5, a42=0.7, a43=1.2). All procedures of signal generation were repeated under the following conditions: It is worth noticing that the levels chosen for both SNR and LENGTH factors cover the typical range for the cortical activity estimated with high resolution EEG techniques. Signal generation for the DTF methodolog Different sets of test signals have been generated in order to fit an imposed coupling scheme, involving four different cortical areas (shown in Fig.2), as well as to respect imposed levels of Signal to Noise Ratio (factor SNR) and duration (factor LENGTH). Signal z1(t) was a reference cortical waveform estimated from a high resolution EEG recording in a healthy subject, during the execution of self-paced movements of the left finger. Subsequent signals z2(t) - z4(t) were iteratively obtained according to the imposed scheme (Fig.2), by adding to signal zj contributions from the other signals, delayed by intervals tij and amplified by factors aij, plus an uncorrelated Gaussian white noise. Coefficients of the connection strengths were chosen in a range of realistic values as met in previous studies, during the application of other connectivity estimation techniques, like the Structural Equation Modeling, in several memory, motor and sensory tasks [Buchel and Friston, 1997]. Here, the values used for the connection strength were a21=1.4, a31=1.1, a32=0.5, a42=0.7, a43=1.2. The values used for the delay from the i-th ROI to the j-th one (tij) ranged from 1 sample up to the q-2, where q was the order of the MVAR model used. Since the statistical analysis performed with different values of such delay samples returned the same information with respect the variation of this parameter, in the following we particularized the results to the case τ21= τ31= τ32 = τ42 = τ43 = 1 sample, that for a sampling rate of 64 Hz became a delay of 15 ms. All procedures of signal generation were repeated under the following conditions: Performance Evaluation In order to evaluate the quality of the performed estimation, the Frobenius norm of the matrix reporting the differences between the values of the estimated (via SEM) and the imposed connections (Relative Error) was computed for the connectivity patterns obtained with the SEM methodology
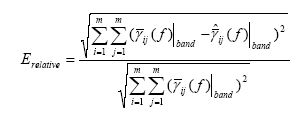
In the case in which the DTF method was used, the statistical evaluation of DTF performances required a precise definition of an error function, describing the goodness of the pattern recognition performed. This was achieved by focusing on MVAR model structure since the MVAR model coefficients can be put in relation with the coefficients used in the signal generation, and they are different from zero only for k= τij, where tij is the delay chosen for each pair ij of ROIs and for each direction among them. Thus, with the estimation of the MVAR model parameters, we aim to recover the original coefficients aij(k), used in signal generation. In this way, reference DTF functions have been computed, on the basis of the signal generation parameters. The error function was then computed as the difference between these reference functions and the estimated ones (both averaged in the frequency band of interest). To evaluate the performances in retrieving the connections between areas, the same index used in the case of the SEM was adopted, but with light differences of notation, i.e. the Frobenius norm of the matrix reporting the differences between the values of the estimated and the imposed connections (Total Relative Error);
In the previous formula,  represents the average value of DTF function
from j to i, in the frequency band of interest. For both SEM and DTF the
simulations were performed by repeating for 50 times each generation-estimation
procedure, in order to increase the robustness of the successive statistical analysis.
represents the average value of DTF function
from j to i, in the frequency band of interest. For both SEM and DTF the
simulations were performed by repeating for 50 times each generation-estimation
procedure, in order to increase the robustness of the successive statistical analysis.
Statistical analysis The results obtained were subjected to separate Analysis of Variance (ANOVA). The main factors of the ANOVAs for the DTF method were the SNR (with five levels: 0.1, 1, 3, 5, 10) and the signal LENGTH (with six levels for the : 960, 2880, 4800, 9600, 19200, 38400 samples, equivalent to 15, 45, 75, 150, 300, 600 seconds at 64 Hz of sampling rate). In the case of SEM method, the main factors were identical but the length has only four levels (equal to 60, 190,310, and 610 seconds at 64 Hz). For all the methodologies used, ANOVA was performed on the error index adopted (Relative Error). The correction of Greenhouse-Gasser for the violation of the spherical hypothesis was used. The post-hoc analysis with the Duncan test at the p = 0.05 statistical significance level was then performed. 2.4. Imaging cortical connectivity in humans The methods of estimating connectivity patterns by using the DTF and SEM have been evaluated in human subjects using a simple movement task [Astolfi et al., 2005a,b,c; Babiloni et al., 2005a]. In particular, we considered the right hand finger tapping movement, externally paced by a visual stimulus. This task was chosen for it has been very well studied in literature with different brain imaging techniques like EEG or functional Magnetic Resonance Imaging [Jancke et al., 2000, Gevins et al., 1989, Gerloff et al., 1998]. Subject and Experimental Design Three right-handed healthy subjects (age 23.3 ± 0.58, 1 male and 2 females) participated in the study after the informed consent was obtained. Subjects were seated comfortably in an armchair with both arms relaxed and resting on pillows and they were requested to perform fast repetitive right finger movements. During motor task, subject was instructed to avoid eye blinks, swallowing, or any movement other than the required finger movements. Head and cortical models Subject's realistic head models reconstructed from T1-weighted MRIs were employed in this study. Scalp, skull and dura mater compartments were segmented from MRIs with a software originally developed at the Dept. of Human Physiology of the University of Rome, and such structures were triangulated with about 1,000 triangles for each surface. The source model was built with the following procedure: (i) the cortex compartment was segmented from MRIs and triangulated obtaining a fine mesh with about 100,000 triangles; (ii) a coarser mesh was obtained by resampling the fine mesh previously described to about 5,000 triangles. The downsampling was performed with an adaptive algorithm aimed to represent with a sufficient number of triangles the part of the cortex where the radius of curvature was high, like for instance during the bending of a sulcus, while attempted to represent with few triangles the part of the cortical surface sufficiently flat, like for instance on the upper part of the gyri; (iii) an orthogonal unitary equivalent current dipole was placed in each node of the triangulated surface, with direction parallel to the vector sum of the normals to the surrounding triangles. EEG recordings Event related potential (ERP) data were recorded with 96 electrodes; data were recorded with a left ear reference and submitted to the artifact removal processing. Six hundred ERP trials of 600 ms of duration were acquired. A/D sampling rate was 250Hz. The surface electromyographic (EMG) activity of the muscle was also collected. The onset of the EMG response served as zero time. All data were visually inspected, and trials containing artifacts were rejected. We use semi-automatic supervised threshold criteria for the rejection of trials contaminated by ocular and EMG artifacts, as described in details elsewhere [Moretti et al., 2003]. After the EEG recording, the electrode positions were digitized using a 3D localization device with respect to the anatomic landmarks of the head (nasion and two preauricular points). The analysis period for the potentials time-locked to the movement execution was set from 300 ms before to 300 ms after the EMG trigger (0 time); the ERP time-course was divided in two phases relative to the EMG onset; the first, labeled as "PRE" period, marked the 300 ms before the EMG onset and was intended as a generic preparation period; the second labeled as "POST", lasted up to 300 ms after the EMG onset and was intended to signal the arrival of the movement somatosensory feedback. We kept the same PRE and POST nomenclature for the signals estimated at the cortical level. Estimation of Cortical Source Current Density The solution of the following linear system:
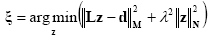
In Eq. (3) L is the lead field or the forward transmission matrix, in which each j-th column describes the potential distribution generated on the scalp electrodes by the j-th unitary dipole. The current density solution vector ξ was obtained as follows [Grave de Peralta Menendez, 1999]:
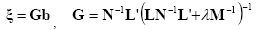
where M, N are the matrices associated to the metrics of the data and of the source space, respectively, λ is the regularization parameter and || z ||M represents the M-norm of the vector z. The solution of Eq. (4) is given by the inverse operator G as follows:
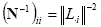
An optimal regularization of this linear system was obtained by the L-curve approach [Hansen, 1992]. As a metric in the data space we used the identity matrix, while as a norm in the source space we use the following metric:
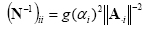
where (N-1)ii is the i-th element of the inverse of the diagonal matrix N and all the other matrix elements Nij, for each i≠j, are set to 0. The L2 norm of the i-th column of the lead field matrix L is denoted by ||Li||. Here, we present a characterization of the source metric N that can provide the basis for the inclusion of the information about the statistical hemodynamic activation of i-th cortical voxel into the linear inverse estimation of the cortical source activity. In the fMRI analysis, several methods to quantify the brain hemodynamic response to a particular task have been developed. However, in the following we analyze the case in which a particular fMRI quantification technique has been used, called Percent Change (PC) technique. This measure quantifies the percentage increase of the fMRI signal during the task performance with respect the rest state [Kim et al., 1993]. The visualization of the voxels' distribution in the brain space that is statistically increased during the task condition with respect to the rest is called the PC map. The difference between the mean rest- and movement-related signal intensity is generally calculated voxel-by-voxel. The rest-related fMRI signal intensity is obtained by averaging the pre-movement and recovery fMRI. Bonferroni-corrected Student's t-test is also used to minimize alpha inflation effects due to multiple statistical voxel-by-voxel comparisons (Type I error; p<0.05). The introduction of fMRI priors into the linear inverse estimation produces a bias in the estimation of the current density strength of the modeled cortical dipoles. Statistically significantly activated fMRI voxels, which are returned by the percentage change approach [Kim et al., 1993], are weighted to account for the EEG measured potentials. In fact, a reasonable hypothesis is that there is a positive correlation between local electric or magnetic activity and local hemodynamic response over time. This correlation can be expressed as a decrease of the cost in the functional Φ of Eq. 4 for the sources zj in which fMRI activation can be observed. This increases the probability for those particular sources zj to be present in the solution of the electromagnetic problem. Such thoughts can be formalized by particularizing the source metric N, to take into account the information coming from the fMRI. The inverse of the resulting metric is then proposed as follows [Babiloni et al., 2000]:
in which (N-1)ii and ||A-i|| has the same meaning described above. g(αi) is a function of the statistically significant percentage increase of the fMRI signal assigned to the i-th dipole of the modeled source space. Fixing K = 1 let us disregard fMRI priors, thus returning to a purely electrical solution; a value for K » 1 allows only the sources associated with fMRI active voxels to participate in the solution. It was shown that a value for K in the order of 10 (90% of constraints for the fMRI information) is useful to avoid mislocalization due to over constrained solutions [Liu et al., 1998, Dale et al., 2000, Liu, 2000]. Regions of interest (ROIs) Several cortical regions of interest (ROIs) were drawn by two independent and expert neuroradiologists on the computer-based cortical reconstruction of the individual head models. In the case in which the SEM methodology was adopted, we selected ROIs based on previously available knowledge about the flow of connections between different cortical macroareas, as derived from neuroanatomy and fMRI studies. In particular, information flow were hypothesized to exist from the parietal (P) areas toward the sensorimotor (SM), the premotor (PM) and the prefrontal (PF) ones [Gerloff et al., 1998, Jancke et al., 2000, Urbano et al., 1998], whereas the prefrontal areas (PF) were defined by including at large the Brodmann areas 8, 9, and 46; the premotor areas (PM) by including the Brodmann area 6, the sensorimotor areas (SM) including the Brodmann areas 4, 3, 2, and 1, and the parietal areas (P), generated by the union of the Brodmann areas 5 and 7 (See colored areas in Fig. 5). In the case in which the DTF method was used we select the ROIs representing the left and right primary somatosensory (S1) areas included the Brodmann areas (BA) 3, 2, 1, while the ROIs representing the left and right primary motor (MI) included the BA 4. The ROIs representing the Supplementary Motor Area (SMA) were obtained from the cortical voxels belonging to the BA 6. We further separate the proper and anterior SMA indicated with BA 6P and 6A, respectively. Furthermore, ROIs from the right and the left parietal areas including the BA 5, 7 and the occipital areas (BA 19) were also considered. In the frontal regions the BA 46, 8, 9 were also selected. (See colored areas in Fig. 6). Cortical current waveforms By using the relations described above, at each time point of the gathered ERP data an estimate of the signed magnitude of the dipolar moment for each of the 5,000 cortical dipoles was obtained. In fact, since the orientation of the dipole was already defined to be perpendicular to the local cortical surface of the model, the estimation process returned a scalar rather than a vector field. In order to obtain the cortical current waveforms for all the time points of the recorded EEG time series, we used a unique "quasi-optimal" regularization λ value for all the analyzed EEG potential distributions. Such quasi-optimal regularization value was computed as an average of the several λ values obtained by solving the linear inverse problem for a series of EEG potential distributions. These distributions are characterized by an average Global Field Power (GFP) with respect to the higher and lower GFP values obtained during all the recorded waveforms. The instantaneous average of the dipole's signed magnitude belonging to a particular ROI generates the representative time value of the cortical activity in that given ROI. By iterating this procedure on all the time instants of the gathered ERP, the cortical ROI current density waveforms were obtained and they could be taken as representative of the average activity of the ROI, during the task performed by the experimental subjects. These waveforms could then be subjected to the SEM and DTF processing in order to estimate the connectivity pattern between ROIs, by taking into account the time-varying increase or decrease of the power spectra in the frequency bands of interest. Here, we present the results obtained for the connectivity pattern in the alpha band (8-12 Hz), since the ERP data related to the movement preparation and execution are particularly responsive in such frequency interval (for review, see [Pfurtscheller and Lopes da Silva, 1999]). 3. Results
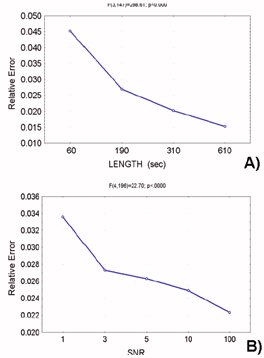
3.1. Computer Simulations for SEM Each set of signals was generated as described in the Methods section, in order to fit a predefined connection model as well as to respect different levels of the two factors SNR and LENGTH of the recordings. The signals resulting were analyzed by means of the freeware software LISREL, which gave as a result an estimation of the connection strengths. Fig. 2 shows the connection model used in the signal generation and in the parameter estimation. The arrows represent the existence of a connection directed from the signal zi toward the signal zj, while the values on the arcs aij represent the connection parameters. The results obtained for the statistical analysis performed on the 50 repetition of the procedure are reported in Fig. 3, representing the plot of means of the Relative Error with respect to signal LENGTH and SNR. ANOVA has pointed out a rather strong statistical significance of both factors considered. The factors SNR and LENGTH were both highly significant (factor LENGTH F=288.60, p<0.0001, factor SNR F= 22.70, p<0.0001). Fig.3a shows the plot of means of the Relative Error with respect to the signal length levels, which reveals a decrease of the connectivity estimation error with the increase of the length of the available data. Fig 3b shows the plot of means with respect to different SNR levels employed in the simulation. Since the main factors were found highly statistically significant, post-hoc tests (Duncan at 5%) were then applied. Such tests showed statistically significant differences between all levels of the factor LENGTH, while there is no statistically significant difference between levels 3, 5 and 10 of the factor SNR.
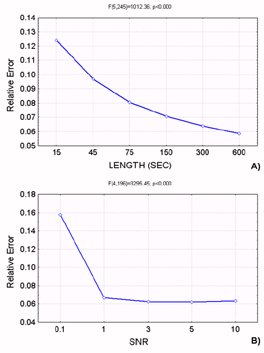
3.2. Computer Simulations for DTF The connectivity model used in the signal generation was the same employed for the SEM simulation, which is shown in the Fig. 2 already described. A multivariate autoregressive model of order 8 has been fitted to each set of simulated data. Then, the normalized DTF functions have been computed from each autoregressive model. The procedure of signal generation and DTF estimation has been carried out for 50 times for each level of factors SNR and LENGTH. The index of performances used, i.e. the Relative Error, has been computed for each generation-estimation procedure performed, and then subjected to Analysis of Variance (ANOVA). In this statistical analysis, Relative Error was the dependent variable, while the different SNR and LENGTH imposed in the signal generation were the main factors. ANOVA revealed a strong statistical influence of all the main factors (SNR and LENGTH; for Relative Error we obtained: SNR: F=3295.5, p<0.0001; LENGTH: F= 1012.4, p<0.0001). Figure 4 shows the influence of factors SNR and LENGTH on Relative Error. In detail, Fig.4a shows the plot of means of the Relative Error with respect to the signal LENGTH levels, which reveals a decrease of the connectivity estimation error with the increase of the length of the available data; Fig 4b shows the plot of means with respect to different SNR levels employed in the simulation. In particular, for a SNR between 3 and 10, the expected error in the estimation of the connectivity pattern was generally under the 7%, and the same values are obtained for ERP recording longer than
Figure 3. Results of ANOVA performed on the Relative Error resulting from SEM simulations. A): plot of means with respect to signal LENGTH as a function of time (seconds). ANOVA shows a high statistical significance for factor LENGTH (F=288.60, p<0.0001). Post-hoc test (Duncan performed at 5% level of significance) shows statistically significant differences between all levels. B): plot of means with respect to Signal to Noise Ratio. Here, too, a high statistical influence of factor SNR on the error in the estimation is shown (F= 22.70, p<0.0001). Duncan post-hoc test (performed at 5%) points out that there is no statistically significant difference between levels 3, 5 and 10 of factor SNR. Figure 4. Results of ANOVA performed on the Relative Error resulting from DTF simulations. A): plot of means with respect to signal LENGTH as a function of time (seconds). ANOVA shows a high statistical significance for factor LENGTH (F=1012.36, p<0.0001). Post-hoc test (Duncan performed at 5% level of significance) shows statistically significant differences between levels 15 and 45 seconds at 64 Hz sampling rate (equivalent of 960 and 2880 samples) of the factor LENGTH and all the other levels. B): plot of means with respect to Signal to Noise Ratio. Here, too, a high statistical influence of factor SNR on the error in the estimation is shown (F= 3295.45, p<0.0001). Duncan post-hoc test (performed at 5%) points out that there is no statistically significant difference between levels 3, 5 and 10 of factor SNR.
150 seconds. Since the main factors have been found statistically significant, post-hoc tests (Duncan test at 5%) were then applied. The results have shown statistically significant differences between the levels 15 and 45 seconds (960 and 2880 samples, respectively) of the factor LENGTH and the other levels, while there is no statistically significant difference between levels 3, 5 and 10 of the factor SNR.
3.3. Imaging cortical connectivity in humans The results of the application of the SEM method for the estimation of the connectivity on the event related potential recordings is depicted in Fig 5, which shows the statistical significant cortical connectivity patterns obtained for the period preceding the movement onset in the subject #1, in the alpha frequency band. Each pattern is represented with arrows, that connect one cortical area ("the source") to another one ("the target"). The colors and sizes of arrows code the level of strength of the functional connectivity observed between ROIs. The labels indicate the names of the ROIs employed. Note that the connectivity pattern during the period preceding the movement in the alpha band involves mainly the parietal left ROI (Pl) coincident with the Brodmann areas 5 and 7, functionally connected with the left and right premotor cortical ROIs (PMl and PMr), the left sensorimotor area (SMl), and both the prefrontal ROIs (PFl and PFr). The stronger functional connections are relative to the link between the left parietal and the premotor areas of both cerebral hemispheres. After the preparation and the beginning of the finger movement, in the POST period changes in the connectivity pattern can be noted. In particular, the origin of the functional connectivity links is positioned in the sensorimotor left cortical areas (SMl). From there, functional links are established with prefrontal left (PFl), both the premotor areas (PMl. PMr). A functional link emerged in this condition connecting the right parietal area (Pr) with the right sensorimotor area (SMr). The left parietal area (Pl) so active in the previous condition was instead linked with the left sensorimotor (SMl) and right premotor (PMr) cortical areas.
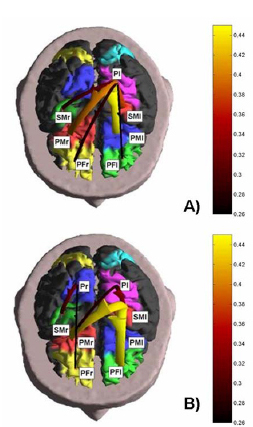
Figure 5. Figure shows the cortical connectivity pattern obtained with the SEM method, for the period preceding and following the movement onset in the subject, in the alpha (8-12 Hz) frequency band. The realistic head model and cortical envelope of the subject analyzed obtained from sequential MRIs is used to display the connectivity pattern. Such pattern is represented with arrows moving from one cortical area toward another one. The colors and sizes of arrows code the level of strengths of the functional connectivity observed between ROIs. The labels are relative to the name of the ROIs employed. A): Connectivity pattern obtained from ERP data before the onset of the right finger movement (electromyographic onset; EMG). B): Connectivity patterns obtained after the EMG onset. Same conventions as above. Connectivity estimations performed by DTF on the movement related potentials were first analyzed from a statistical point of view via the shuffling procedure above described. The order of the MVAR model used for each DTF estimation had to be determined for each subject and in each temporal interval of the cortical waveforms segmentation (PRE and POST interval). The Akaike Information Criterion (AIC) procedure was used and returned an optimal order between 6 and 7 for all the subjects, in both PRE and POST intervals. On such cortical waveforms, the DTF computational procedure described in the Methods section was applied. Figure 6 shows the cortical connectivity patterns obtained for the period preceding and following the movement onset in the subject #1 examined. Here, we present the results obtained for the connectivity pattern in the alpha band (8-12 Hz), since the ERP data related to the movement preparation and execution are particularly responsive in such frequency interval (for a review, see [Pfurtscheller and Lopes da Silva, 1999]). The task-related pattern of cortical connectivity was obtained by calculating the DTF between the cortical current density waveforms estimated in each ROI depicted on the realistic cortex model. The connectivity patterns between the ROIs have been represented by arrows pointing from one cortical area toward another one. The arrows color and size code the strength of the functional connectivity estimated between the source and the target ROI. Labels indicate the ROIs involved in the estimated connectivity pattern. Only the cortical connections statistically significant at p < 0.01 are represented, according to the thresholds obtained by the shuffling procedure described above. It can be noted that the connectivity patterns during the period preceding and following the movement in the alpha band involves bilaterally the parietal and sensorimotor ROIs, which are also functionally connected with the premotor cortical ROIs. A minor involvement of the prefrontal ROIs is also observed. The stronger functional connections are relative to the link between the premotor and prefrontal areas of both cerebral hemispheres. After the preparation and the beginning of the finger movement, in the POST period slight changes in the connectivity patterns can be noted.
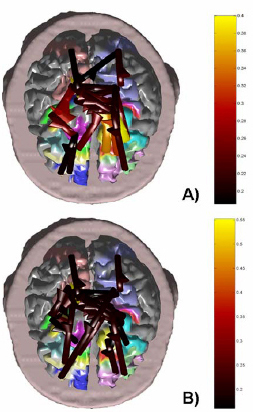
Figure 6. Cortical connectivity patterns obtained by the DTF method, for the period preceding and following the movement onset, in the alpha (8-12 Hz) frequency band. The patterns are shown on the realistic head model and cortical envelope of the subject analyzed, obtained from sequential MRIs. Functional connections are represented with arrows, moving from a cortical area toward another one. The arrows' colors and sizes code the strengths of the connections. A): Connectivity pattern obtained from ERP data before the onset of the right finger movement (electromyographic onset; EMG). B): Connectivity patterns obtained after the EMG onset. Same conventions as above.
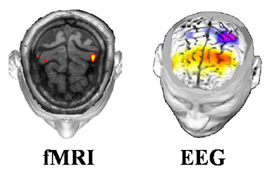
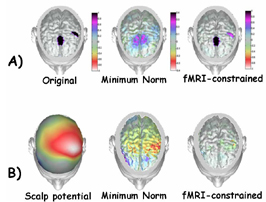
3.4. Application of the multimodal EEG-fMRI integration techniques to the estimation of sources of self-paced movements In this section we will provide a practical example of the application of multimodal integration techniques of EEG and fMRI (as theoretically described in the previous sections) to the problem of detection of neural sources subserving unilateral self-paced movements in humans. The high resolution EEG recordings (128 scalp electrodes) were performed on normal healthy subjects by using the facilities available at the laboratory of the Department of Human Physiology, University of Rome "La Sapienza". Realistic head models were used, each one provided with a cortical surface reconstruction tessellated with 5,000 current dipoles. Separate block design fMRI recordings of the same subjects were performed by using the facilities of the Istituto Tecnologie Avanzate Biomediche (ITAB) of Chiety, Italy. Distributed linear inverse solutions by using hemodynamic constraints were obtained according to the methodology presented above. Figure 7 presents the typical situation occurring when different imaging methods are used to characterize the brain activity generated during a specific task. In particular, the task performed by the subject was the self-paced movement of the middle finger of the right hand. Such task was performed not simultaneously under three different scanners, namely the fMRI, the HREEG and the MEG ones. On the left of the Fig.7 there is a view of some cerebral areas active during the movement, as reported by fMRI. The maximum values of the fMRI responses are located in the voxels roughly corresponding to the primary somatosensory and motor areas (hand representation) contralateral to the movement. In fact, during the self-paced unilateral finger extension, somatosensory reafference inputs from finger joints as well as cutaneous nerves are directed to the primary somatosensory area, while centrifugal commands from the primary motor area are directed toward the spinal cord via the pyramidal system. At the centre of the figure is represented the dura mater potential distribution estimated with the use of the SL operator over a cortical surface reconstruction. The deblurred distribution is obtained at the 100 ms after the EMG onset of the right middle finger. Note the characteristic reverse negative and positive SL fields on the left hemisphere. It is easy to appreciate the different time resolution of the different techniques, being the fMRI data relative to the whole time course of the experiment, while the high resolution EEG data is relative to a particular on ms of the cortical electromagnetic field evolution related to the same experiment. Simulations performed to test the efficacy of the multimodal integration of HREEG and fMRI return the information that the inclusion of fMRI priors improve the reconstruction of cortical activity [Liu et al., 1998, Babiloni et al., 2003]). Figure 8 upper row (A) presents three cortical current density distributions. The left one showed the cortical regions roughly corresponding to the supplementary motor area and the left motor cortex with the imposed activations represented in black. The imposed activations generated a potential distribution over the scalp electrodes (not showed in the figure). From this potential distribution different inverse operators without and with the use of fMRI priors (that are located in the supplementary and left motor areas) attempted to estimate the current density distribution. The current density reconstruction at the centre of the first row of the Fig. 8 presents the results of the estimation of sources presented on the left map without the use of fMRI priors by using the minimum norm estimate procedure. The current density reconstruction on the right of the figure presents the cortical activations recovered by the use of fMRI priors. The lower row of the Fig. 8 (B) illustrates the cortical distributions of the current density estimated with the described linear inverse approaches from the potential distribution relative to the movement preparation, about 200 ms before a right middle finger extension. Such an approach used no-fMRI constraint as well the fMRI constraints . On the left of the Fig. 8B is presented the topographic map of readiness potential distribution recorded at the scalp about 200 ms before a right middle finger extension for another subject analyzed. Note the extension of the maximum of the negative scalp potential distribution, roughly overlying frontal and centro-parietal areas contralateral to the movement. The cortical distributions are represented on the realistic subject's
Figure 7. Figure presents on the left a view of some cerebral areas active during the self-paced movement of the right finger, as reported by fMRI. At the righ of the figure is represented the dura mater potential distribution estimated with the use of the SL operator over a cortical surface reconstruction. The deblurred distribution is obtained at the 100 ms after the EMG onset of the right middle finger.
head volume conductor model in the center and at the right of the Fig. 8B. Linear inverse solution obtained with the fMRI priors presents more localized spots of activations with respect to those obtained with the no fMRI priors. Remarkably, the spots of activation were localized in the hand region of the primary somatosensory (post-central) and motor (pre-central) areas contralateral to the movement. In addition, spots of minor activation were observed in the frontocentral medial areas (including supplementary motor area) and in the primary somatosensory and motor areas of the ipsilateral hemisphere.
Figure 8. The upper row of the Figure (A), presents three cortical current density distributions. The left one showed the simulated cortical regions roughly corresponding to the supplementary motor area and the left motor cortex with the imposed activations represented in black. The current density reconstruction at the centre of the figure presents the results of the estimation of sources presented on the left map without the use of fMRI priors, by using the minimum norm estimate procedure. The current density reconstruction on the right of the figure presents the cortical activations recovered by the use of fMRI priors. The second row of the Figure B) illustrates the scalp (left) and the cortical distributions (center and right) of the current density estimated with the linear inverse approaches from the potential distribution relative to the movement preparation, about 200 ms before a right middle finger extension. The distributions are represented on the realistic subject's head volume conductor model. Left: scalp potential distribution recorded 200 ms before movement execution. Center: cortical estimate obtained without the use of fMRI constraints, based on the minimum norm solutions. Right: cortical estimate obtained with the use of fMRI constraints.
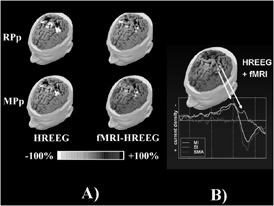
Another example of multimodal integration between EEG and fMRI related to a simple voluntary movement task by using only the hemodynamic information relative to the strength of fMRI data is provided in Fig. 9. Fig. 9A shows the amplitude gray scale maps of linear source inverse estimates from EEG (first column) and combined fMRI-EEG (second column) data. The estimates were computed about 50 ms before (Readiness Potential peak, RPp; first row) and 20 ms after (Motor Potential peak, MPp; second row) the onset of the electromyographic response to voluntary right finger movements. The linear inverse estimates of neural activity were mapped over the cortical compartment of a realistic MRI-constructed subject's head model. The RPp map (first row) presents maximum responses in the contralateral M1 and S1 and in the modeled SMA. Activation is stronger in proximity of the movement onset (MPp maps, second row). With respect to the high resolution EEG solutions (left column), the fMRI-EEG solutions present more circumscribed M1, S1, and SMA responses (second column). In addition, the contralateral M1 and S1 responses have similar intensity and are spatially dissociated. Fig. 9B shows the cortical distribution of the current density estimated with the linear inverse approach from the potential distribution of the movement-related potentials with the inclusion of the fMRI priors. The current density waveforms relative to the average values of the estimated activations along the task performed are also presented. It is worth of note that the cortical activity relative to the Brodmann areas is here estimated with just the use of non-invasive electrophysiological and hemodynamical measurement procedures.
Figure 9. The left part of the Figure (A) shows amplitude gray scale 3-D maps obtained by linear inverse estimates from high resolution electroencephalographic (HREEG) and combined functional magnetic resonance image (fMRI)-HREEG data computed from a subject about 50 ms before (readiness potential peak, RPp) and 20 ms after (motor potential peak, MPp) the onset of the electromyographic activity associated with self-paced right middle finger movements. Percent gray scale of HREEG and combined fMRI-HREEG data is normalized with reference to the maximum amplitude calculated for each map. Maximum negativity (-100%) is coded in white and maximum positivity (+100%) in black. The right part of the Figure (B) presents the estimation of the current density waveforms in regions of interest (ROIs) coincident with the Brodmann areas. The waveforms estimated are relative to the estimation performed with the use of the information from hemodynamic measurements.
4. Discussion
4.1. Simulation Results for SEM and DTF In this section we would like to briefly discuss the main aspects of the simulations performed for both SEM and DTF [Astolfi et al., 2005a, b,c], in order to stress comparatively they merits and drawbacks. The experimental design adopted for the employed simulation study was aimed to analyze the most common situations in which the proposed application of SEM technique to high resolution EEG data may take place. The levels chosen for main factor levels SNR and LENGTH, covered the most typical situations that can occur in this analysis. The obtained results indicate a clear influence of different levels of the main factors SNR and LENGTH on the efficacy of the estimation of cortical connectivity via SEM. In detail, a) a variable SNR level imposed on the high resolution EEG data significantly influenced the accuracy of the connectivity pattern estimation. In particular, an SNR=3 seemed to be satisfactory in order to obtain a good accuracy, since there were not significant differences in the performance for higher values; b) a usable accuracy in the estimation of connectivity between cortical areas was achieved with a minimum of 190 seconds of EEG registration (equivalent, for instance, to 380 trials of 500 ms each). However, an increase of the length of the available EEG data is always related to a decrease of the connectivity estimation error. It might be argued how the present findings, obtained by using several levels of cortical SNR, could be directly extended to the SNR related to the scalp recorded EEG data. In general, a difference exists between the imposed SNR at the cortical level and those observed at the scalp level. This difference is due to the errors in the estimation procedure of the cortical activity. These errors, already described in simulation studies in literature [Babiloni et al., 2004, Liu et al., 2002, Liu, 2000], could be treated as additional source of noise in the propagation from the cortex to the scalp. Such simulations indicated that for high resolution EEG studies with a realistic head modeling tessellation ranging from 3000 to 5000 dipoles, the Relative Errors in the cortical estimation are less than 10%. Hence, we could insert this 10% error in the cortical estimate due to the inversion process as an additional noise source error. In this hypothesis, the cortical SNR can hardly be higher than 10, even if the scalp SNR is very high, due to the inversion error introduced by linear inverse procedure. On the other hand, when the scalp SNR is much lower than 10, the contribution of the inversion error vanishes. In the intermediate cases, the cortical SNR is only slightly lower than scalp SNR; a scalp SNR equal to 3, for instance, would yield a cortical SNR equal to 2.3. It is worth noticing that these SNR conditions are generally obtained in many standard EEG recordings of event-related activity in humans, usually characterized by values of SNR ranging from 3 (movement related potentials) to 10 (sensory evoked potentials) and a total length of the recordings starting from 50 seconds [Regan, 1989]. The results obtained with the SEM technique seem to indicate the opportunity to use connectivity models not too detailed, in terms of cortical areas involved, as a first step of the network modeling. By using a coarse model of the cortical network to be fitted on the EEG data, there is an increase of the statistical power and a decrease of the possibility to generate an error in a single arc link [Horwitz, 2003]. In the present human study, such observation was taken into account by selecting a coarse model for the brain areas subserving the task being analyzed. This simplified model does not take complete account all the possible regions engaged in the task, and all the possible connections between them. Elaborate models, permitting also cyclical connections between regions can become computationally unstable [McIntosh and Gonzalez-Lima, 1994]. Our findings indicated a clear influence of different levels of the main factors SNR and LENGTH on the efficacy of the estimation of cortical connectivity via DTF. In particular, it has been noted that a SNR equals to 3 and a LENGTH of the estimated cortical data of 75 seconds at 64 Hz (4800 data samples) were necessary to decrease significantly the errors on the indexes of quality adopted. The information obtained by the simulation study were used to evaluate the applicability of this method to actual event-related recordings. The gathered ERP signals related to the finger tapping data analyzed showed an SNR between 3 and 5. Furthermore, the total recording length of the gathered ERP data was obtained by 600 trials of 600 ms length. Therefore, according to the simulation results, we applied the DTF method on the estimated cortical current density data expecting a limited amount of errors in the estimation of cortical connectivity patterns. The use of DTF to assess cortical connectivity is an interesting procedure, since it provides directional information, i.e. it allows establishing the direction of the information flow between two particular cortical areas. This information is not generally available by means of several other techniques to assess coupling between signals, as for instance the standard coherence. The evaluation of several methods for the computation of the functional connectivity between couple of EEG/MEG signals was recently performed [David et al., 2004]. It has been concluded that although nonlinear methods, as mutual information, nonlinear correlation and generalized synchronization [Roulston, 1999, Pijn et al., 1992, Stam, 2002, Stam et al., 2003], might be preferred when studying EEG broadband signals which are sensitive to dynamic coupling and nonlinear interactions expressed over many frequencies, the linear measurements are still very useful since they afford a rapid and straightforward characterization of functional connectivity.
4.2. Imaging cortical connectivity in humans In the case in which the SEM methodology was applied on the recorded high resolution EEG data our model of interactions between cortical areas is based on previous results on similar tasks obtained with fMRI. Such model is sufficient to address some key questions regarding the influence of the premotor and motor areas toward the prefrontal cortical areas during the task analyzed. The finger tapping data analyzed here present a high SNR and a large number of trials, resulting in an extended record of ERP data. Hence, the simulation results suggest the optimal performance of the SEM method as applied to the human ERP potentials. The connectivity pattern estimated via SEM reveals the potentiality of the employed methodology including the use of high resolution EEG recordings, the generation of a realistic head model by using sequential MRIs, and the estimation of the cortical activity with the solution of linear inverse problem. With this methodology, it would be possible not only to detect which of the cortical areas activate during a particular (motor) task but also how these areas are effectively inter-connected in subserving that given task. In particular, the influence of the parietal area has been observed toward the premotor cortical areas during the task preparation, consistent with the role that the parietal areas have in the engagement of attentive resources as well as temporization, as assessed by several electrophysiological studies on primate or hemodynamical studies on humans [Culham and Kanwisher, 2001]. It is of interest the shift of the cortical areas behaving as the most relevant origin of functional links, occurring when the somatosensory reafferences arrive from the periphery to the cortex. In fact, the left sensorimotor area becomes very active with respect to the left parietal one, which, in turn, are used to be mainly engaged in the time period preceding the finger movement. Connections between the sensorimotor area and the premotor and left prefrontal areas are appropriate to distribute the information related to the movement of the finger to the higher functional regions (prefrontal and premotor). From a physiological point of view, our results obtained by estimating the connectivity patterns with the DTF are consistent and integrate those already present in literature on simple finger movements, as they have been obtained with neuroelectric measurements. A study employing ERP measurements from scalp electrodes and the assessment of connectivity with the non directional coherence methods has underlined the role of the primary sensorimotor and supplementary motor areas in the processing of the movements [Gerloff et al., 1998]. The connectivity patterns depicted in the premotor and prefrontal ROIs here analyzed, are in agreement with earlier hypotheses formulated in literature [Sekihara and Scholz, 1996, Classen et al., 1998, Rothwell et al., 1991]. The aforementioned studies have suggested as the dorsolateral and the ventral premotor cortices are specifically activated by movements guided by sensory information as opposed to movements carried out with no sensory control. The activity noted in the parietal areas (BA 5) in the present study, could be associated with the role that this area has in the somatosensory-motor integration underlying movement performing. In fact, it has been hypothesized that this area could be regarded as a higher-order somatosensory zone devoted to the analysis of proprioceptive information from joints for the appropriate motor control [Rizzolatti et al., 1998].
4.3. Application of the multimodal EEG-fMRI integration technique. In general, there is a rather large consensus about the need and utility of the multimodal integration of metabolic, hemodynamic and neuroelectrical data. Results reviewed in literature as well as those presented here suggest a real improvement in the spatial details of the estimated neural sources by performing multimodal integration. However, while for the multimodal integration of EEG and magnetoencephalographic (MEG) data a precise electromagnetic theory exists, a clear mathematical and physiologic link between metabolic demands and firing rates of the neurons is still lacking. It is out of doubt that when this link is further clarified, the modeling of the interaction between hemodynamic and neural firing rate can be further refined. This will lead us to a more proper characterization of the issues of visible and invisible source that at the moment represent the major concern about the applicability of the multimodal integration techniques [Nunez and Silberstein, 2000]. Recently, it was also suggested as the multimodal integration of high resolution EEG and fMRI will return improved estimations of brain activity as well as of the functional connectivity between cortical areas as returned by the use of DTF [Babiloni et al., 2005a,b]- The results for the multimodal integration of EEG/MEG and fMRI presented here are in line with those regarding the coupling between cortical electrical activity and hemodynamic measure as indicated by a direct comparison of maps obtained using voltage-sensitive dyes (which reflect depolarization of neuronal membranes in superficial cortical layers) and maps derived from intrinsic optical signals (which reflect changes in light absorption due to changes in blood volume and oxygen consumption, [Shoham et al., 1999]). Furthermore, previous studies on animals have also shown a strong correlation between local field potentials, spiking activity, and voltage-sensitive dye signals [Arieli et al., 1996]. Finally, studies in humans comparing the localization of functional activity by invasive electrical recordings and fMRI have provided evidence of a correlation between the local electrophysiological and hemodynamic responses [Puce et al., 1997]. It is worth of note that recently a study aimed at investigating this link has been produced [Logothetis et al., 2001] In this study, intracortical recordings of neural signals and simultaneous fMRI signals were acquired in monkeys. The comparisons were made between the local field potentials, the multi-unit spiking activity and BOLD signals in the visual cortex. The study supports the link between the local field potentials and BOLD mechanism, which is at the base of the procedure of the multimodal integration of EEG/MEG with fMRI described above. This may suggest that the local fMRI responses can be reliably used to bias the estimation of the electrical activity in the regions showing a prominent hemodynamic response.
5. Conclusions Taken together, our recent findings return the information that a rather accurate estimation of the cortical connectivity patterns can be achieved by using realistic geometry models for the head and cortical surfaces, high resolution EEG recordings, and effective and functional cortical connectivity by using the SEM and DTF methods, respectively [Astolfi et al., 2005a,b,c]. The simulation results suggest that in conditions largely met in the ERPs recordings, (SNR at least 3 and a length of the recording EEG superior to 75 seconds at 64 Hz, or to 4800 data samples), the computation of functional connectivity by SEM or DTF can be performed with moderate quantitative errors. The use of high resolution EEG recordings and the estimation of the cortical waveforms in ROIs via the solution of linear inverse problem allows the evaluation of the functional cortical connectivity patterns related to the task performed. These computational tools (high resolution EEG, estimation of cortical activity via linear inverse problem, SEM and DTF) could be of interest to assess time-varying functional connectivity patterns from non invasive EEG recordings in humans. Such procedures can be integrated by using the information coming from the hemodynamic measurements (as fMRI), since it has been demonstrated as the inclusion of the fMRI priors improve the estimation of the cortical source activity. Recently, evidences in that sense have been presented in literature [Babiloni et al., 2005a,b]. In summary, we have reviewed here an integrated approach to estimate brain cortical activity and connectivity by using noninvasive methodologies involving the multimodal integration of electrophysiological and hemodynamic measurements. These methodologies enable us to detect the level of statistical significance of the estimated cortical activations in the selected ROIs, and to follow the time-varying pattern of connectivity eventually developing during simple motor tasks in humans. This body of methodologies is suitable for the analysis of simple as well as complex movements or cognitive tasks in humans.
Acknowledgements This work was supported in part by the grant NSF BES-0411898.
References Arieli A, Sterkin A, Grinvald A, Aertsen A D. Dynamics of ongoing activity: Explanation of the large variability in evoked cortical responses. Science, 2731868-1871, 1996. Astolfi L., Cincotti F, Babiloni C., Carducci F., Basilisco A, Rossini PM, Salinari S.,. Mattia D., Cerutti S, Ben Dayan D , Ding L., Ni Y, He B. and Babiloni F., Assessing Cortical Functional Connectivity By Linear Inverse Estimation And Directed Transfer Function: Simulations And Application To Real Data, Clinical Neurophysiology, 2005a, in press, Astolfi L., Cincotti F, Babiloni C., Carducci F., Basilisco A, Rossini PM, Salinari S.,. Mattia D., Cerutti S, Ben Dayan D , Ding L., Ni Y, He B. and Babiloni F. Estimation Of The Cortical Connectivity By High Resolution Eeg And Structural Equation Modeling: Simulations And Application To Finger Tapping Data, IEEE Trans. On Biom. Engng., 2005b, in press. Astolfi L., Cincotti F., Mattia D., Salinari S., Babiloni C., Basilisco A., Rossini P. M., Ding L., Ni Y., He B.,Marciani M.G., Babiloni F. Estimation of the effective and functional human cortical connectivity with Structural Equation Modeling and Directed Transfer Function applied on high resolution EEG, Magn. Res. Imag., 2005c, in press Babiloni F., Cincotti F, Babiloni C., Carducci F., Basilisco A, Rossini PM, Mattia D., Astolfi L., Ding L., Ni Y, Cheng K, Christine K, Sweeney J , He B., Estimation of the cortical functional connectivity with the multimodal integration of high resolution EEG and fMRI data by Directed Transfer Function, Neuroimage, 2005a, in press. Babiloni F., Mattia D., Babiloni C., Astolfi L., Salinari S., Basilisco A., Rossini P. M., Marciani M.G., Cincotti F., Multimodal integration of EEG, MEG and fMRI data for the solution of the neuroimage puzzle, Magn. Res. Imag ., 2005b, in press, Babiloni F, Babiloni C, Carducci F, Romani G L, Rossini P M, Angelone L M, Cincotti F. Multimodal integration of high-resolution EEG and functional magnetic resonance imaging data: a simulation study. Neuroimage, 19 (1):1-15, 2003. Babiloni F, Babiloni C, Carducci F, Romani G L, Rossini P M, Angelone L M, Cincotti F. Multimodal integration of EEG and MEG data: a simulation study with variable signal-to-noise ratio and number of sensors. Hum Brain Mapp, 22 (1):52-62, 2004. Babiloni F, Babiloni C, Locche L, Cincotti F, Rossini P M, Carducci F. High-resolution electro-encephalogram: source estimates of Laplacian-transformed somatosensory-evoked potentials using a realistic subject head model constructed from magnetic resonance images. Med Biol Eng Comput, 38 (5):512-519, 2000a. Babiloni F, Carducci F, Cincotti F, Del Gratta C, Pizzella V, Romani G L, Rossini P M, Tecchio F, Babiloni C. Linear inverse source estimate of combined EEG and MEG data related to voluntary movements. Hum Brain Mapp, 14 (4):197-209, 2001. Bollen K A. Structural Equations with latent variables. Wiley and sons, New York, 1989. Bonmassar G, Van Der Moortele P, Purdon P, Jaaskelainen I, Ives J, Vaughan T, Ugurbil K, Belliveau J. 7 Tesla interleaved EEG and fMRI recordings: BOLD measurements. NeuroImage, 13 (6): 2001. Bressler S L. Large-scale cortical networks and cognition. Brain Res Brain Res Rev, 20 (3):288-304, 1995. Brovelli A, Battaglini P P, Naranjo J R, Budai R. Medium-range oscillatory network and the 20-Hz sensorimotor induced potential. Neuroimage, 16 (1):130-141, 2002. Buchel C, Friston K J. Modulation of connectivity in visual pathways by attention: cortical interactions evaluated with structural equation modelling and fMRI. Cereb Cortex, 7 (8):768-778, 1997. Classen J, Gerloff C, Honda M, Hallet M. Integrative visuomotor behavior is associated with interregionally coherent oscillation in the human brain. J Neurophysiol, 31567-1573, 1998. Clifford Carter G. Coherence and time delay estimation. Proc I E E E, 75236-255, 1987. Culham J C, Kanwisher N G. Neuroimaging of cognitive functions in human parietal cortex. Curr Opin Neurobiol, 11 (2):157-163, 2001. Dale A M, Liu A K, Fischl B R, Buckner R L, Belliveau J W, Lewine J D, Halgren E. Dynamic statistical parametric mapping: combining fMRI and MEG for high-resolution imaging of cortical activity. Neuron, 26 (1):55-67, 2000. David O, Cosmelli D, Friston K J. Evaluation of different measures of functional connectivity using a neural mass model. Neuroimage, 21 (2):659-673, 2004. Friston K J. Functional and effective connectivity in neuroimaging: a synthesis. Hum Brain Mapp, 256-78, 1994. Gerloff C, Richard J, Hadley J, Schulman A E, Honda M, Hallett M. Functional coupling and regional activation of human cortical motor areas during simple, internally paced and externally paced finger movements. Brain, 121 ( Pt 8)1513-1531, 1998. Gevins A S, Cutillo B A, Bressler S L, Morgan N H, White R M, Illes J, Greer D S. Event-related covariances during a bimanual visuomotor task. II. Preparation and feedback. Electroencephalogr Clin Neurophysiol, 74 (2):147-160, 1989. Granger C.W.J. Investigating causal relations by econometric models and cross-spectral methods. Econometrica, 37424-428, 1969. Grave de Peralta Menendez R a G A S L. Distributed source models: standard solutions and new developments. In: Analysis of neurophysiological brain functioning. (Ed.Uhl C). Springer Verlag, 1999; 176-201. Grinvald A, Lieke E, Frostig R D, Gilbert C D, Wiesel T N. Functional architecture of cortex revealed by optical imaging of intrinsic signals. Nature, 324 (6095):361-364, 1986. Gross J, Kujala J, Hamalainen M, Timmermann L, Schnitzler A, Salmelin R. Dynamic imaging of coherent sources: Studying neural interactions in the human brain. Proc Natl Acad Sci U S A, 98 (2):694-699, 2001. Gross J, Timmermann L, Kujala J, Salmelin R, Schnitzler A. Properties of MEG tomographic maps obtained with spatial filtering. Neuroimage, 19 (4):1329-1336, 2003. Hansen P C. Analysis of discrete ill-posed problems by means of the L-curve. SIAM Review, 34561-580, 1992a. Hansen P C. Numerical tools for the analysis and solution of Fredholm integral equations of the first kind. Inverse Problems, 8849-872, 1992b. He B, Lian J, Spencer KM, Dien J, Donchin E: "A Cortical Potential Imaging Analysis of the P300 and Novelty P3 Components", Human Brain Mapping, 12: 120-130, 2001. He B, Yao D, Lian J: "High Resolution EEG: On the Cortical Equivalent Dipole Layer Imaging" Clinical Neurophysiology, 113: 227-235, 2002a. He B, D Yao, J Lian, D Wu: "An Equivalent Current Source Model and Laplacian Weighted Minimum Norm Current Estimates of Brain Electrical Activity", IEEE Trans. on Biomedical Engineering, 49: 277-288, 2002b. He B, Lian J: "Spatio-temporal Functional Neuroimaging of Brain Electric Activity", Critical Review of Biomedical Engineering, 30: 283-306, 2002. He B, Zhang Z, Lian J, Sasaki H, Wu S, Towle VL: "Boundary Element Method Based Cortical Potential Imaging of Somatosensory Evoked Potentials Using Subjects' Magnetic Resonance Images", NeuroImage, 16: 564-576, 2002c. Hori J, Aiba M, He B: "Spatio-temporal Cortical Source Imaging of Brain Electrical Activity by means of Time-Varying Parametric Projection Filter", IEEE Trans. Biomedical Engineering, 51: 768-777, 2004. Horwitz B. The elusive concept of brain connectivity. Neuroimage, 19 (2 Pt 1):466-470, 2003. Inouye T, Iyama A, Shinosaki K, Toi S, Matsumoto Y. Inter-site EEG relationships before widespread epileptiform discharges. Int J Neurosci, 82 (1-2):143-153, 1995. Jancke L, Loose R, Lutz K, Specht K, Shah N J. Cortical activations during paced finger-tapping applying visual and auditory pacing stimuli. Brain Res Cogn Brain Res, 10 (1-2):51-66, 2000. Jöreskog K, Sörbom D. LISREL 8.53. 2002. Software International Inc. Ref Type: Computer Program Kaminski M, Ding M, Truccolo W A, Bressler S L. Evaluating causal relations in neural systems: granger causality, directed transfer function and statistical assessment of significance. Biol Cybern, 85 (2):145-157, 2001. Kaminski M J, Blinowska K J. A new method of the description of the information flow in the brain structures. Biol Cybern, 65 (3):203-210, 1991. Kay S M. Modern Spectral Estimation: Theory and Application. Prentice Hall, Englewood Cliffs, NJ, 1988. Kim D S, Duong T Q, Kim S G. High-resolution mapping of iso-orientation columns by fMRI. Nat Neurosci, 3 (2):164-169, 2000. Kim S G, Ashe J, Hendrich K, Ellermann J M, Merkle H, Ugurbil K, Georgopoulos A P. Functional magnetic resonance imaging of motor cortex: hemispheric asymmetry and handedness. Science, 261 (5121):615-617, 1993. Lee L, Harrison L M, Mechelli A. A report of the functional connectivity workshop, Dusseldorf 2002. Neuroimage, 19 (2 Pt 1):457-465, 2003. Liu AK. Spatiotemporal brain imaging. 2000. Massachusetts Institute of Technology, Cambridge, MA. Thesis/Dissertation Liu A K, Belliveau J W, Dale A M. Spatiotemporal imaging of human brain activity using functional MRI constrained magnetoencephalography data: Monte Carlo simulations. Proc Natl Acad Sci U S A, 95 (15):8945-8950, 1998. Liu A K, Dale A M, Belliveau J W. Monte Carlo simulation studies of EEG and MEG localization accuracy. Hum Brain Mapp, 16 (1):47-62, 2002. Logothetis N K, Pauls J, Augath M, Trinath T, Oeltermann A. Neurophysiological investigation of the basis of the fMRI signal. Nature, 412 (6843):150-157, 2001. Magistretti P J, Pellerin L, Rothman D L, Shulman R G. Energy on demand. Science, 283 (5401):496-497, 1999. Malonek D, Grinvald A. Interactions between electrical activity and cortical microcirculation revealed by imaging spectroscopy: implications for functional brain mapping. Science, 272551-554, 1996. Marple S.L. Digital Spectral Analysis with Applications. Prentice Hall, Englewood Cliffs, NJ, 1987. McIntosh A R, Gonzalez-Lima F. Structural equation modelling and its application to network analysis in functional brain imaging. Hum Brain Mapp, 22-22, 1994. Moretti D V, Babiloni F, Carducci F, Cincotti F, Remondini E, Rossini P M, Salinari S, Babiloni C. Computerized processing of EEG-EOG-EMG artifacts for multi-centric studies in EEG oscillations and event-related potentials. Int J Psychophysiol, 47 (3):199-216, 2003. Nunez P. Electric fields of the brain. Oxford University Press, New York, 1981. Nunez P L. Neocortical dynamics and human EEG rhythms. Oxford University Press, New York, 1995. Nunez P L, Silberstein R B. On the relationship of synaptic activity to macroscopic measurements: does co-registration of EEG with fMRI make sense? Brain Topogr, 13 (2):79-96, 2000. Pascual-Marqui R D. Reply to comments by Hamalainen, Ilmoniemi and Nunez. ISBET Newsletter, 616-28, 1995. Pfurtscheller G, Lopes da Silva F H. Event-related EEG/MEG synchronization and desynchronization: basic principles. Clin Neurophysiol, 110 (11):1842-1857, 1999. Pijn J P, Velis D N, Lopes da Silva F H. Measurement of interhemispheric time differences in generalised spike-and-wave. Electroencephalogr Clin Neurophysiol, 83 (2):169-171, 1992. Puce A, Allison T, Spencer S S, Spencer D D, McCarthy G. Comparison of cortical activation evoked by faces measured by intracranial field potentials and functional MRI: two case studies. Hum Brain Mapp, 5 (4):298-305, 1997. Quian Quiroga R, Kraskov A, Kreuz T, Grassberger P. Performance of different synchronization measures in real data: a case study on electroencephalographic signals. Phys Rev, E 65 2002. Regan D. Evoked Potentials and Evoked Magnetic Fields in Science and Medicine. Elsevier Press, New York, 1989. Rizzolatti G, Luppino G, Matelli M. The organization of the cortical motor system: new concepts. Electroencephalogr Clin Neurophysiol, 106 (4):283-296, 1998. Rosen B R, Buckner R L, Dale A M. Event-related functional MRI: past, present, and future. Proc Natl Acad Sci U S A, 95 (3):773-780, 1998. Rothwell J C, Thompson P D, Day B L, Boyd S, Marsden C D. Stimulation of the human motor cortex through the scalp. Exp Physiol, 76 (2):159-200, 1991. Roulston M S. Estimating the errors on measured entropy and mutual information. Physica, D 125285-294, 1999. Schlogl A. Comparison of Multivariate Autoregressive Estimators. 2003. Schlosser R, Gesierich T, Kaufmann B, Vucurevic G, Hunsche S, Gawehn J, Stoeter P. Altered effective connectivity during working memory performance in schizophrenia: a study with fMRI and structural equation modeling. Neuroimage, 19 (3):751-763, 2003. Sekihara K, Scholz B. Generalized Wiener estimation of three-dimensional current distribution from biomagnetic measurements. IEEE Trans Biomed Eng, 43 (3):281-291, 1996. Shoham D, Glaser D E, Arieli A, Wijnbergen C, Toledo Y, Hildesheim R, Grinvald A. Imaging cortical dynamics at high spatial and temporal resolution with novel blue voltage-sensitive dyes. Neuron, 24791-802, 1999. Stam C J, Breakspear M, van Cappellen van Walsum AM, van Dijk B W. Nonlinear synchronization in EEG and whole-head MEG recordings of healthy subjects. Hum Brain Mapp, 19 (2):63-78, 2003. Stam C J, Pijn J P, Suffczynski P, Lopes da Silva F H. Dynamics of the human alpha rhythm: evidence for non-linearity? Clin Neurophysiol, 110 (10):1801-1813, 1999. Stam C J v D B W. Synchronization likelihood:an unbiased measure of generalized synchronization in multivariate data sets. Physica, 163236-251, 2002. Taniguchi M, Kato A, Fujita N, Hirata M, Tanaka H, Kihara T, Ninomiya H, Hirabuki N, Nakamura H, Robinson S E, Cheyne D, Yoshimine T. Movement-related desynchronization of the cerebral cortex studied with spatially filtered magnetoencephalography. Neuroimage, 12 (3):298-306, 2000. Theiler J, Eubank S, Longtin A, Galdrikian B, Farmer J D. Testing for nonlinearity in time series: the method of surrogate data. Physica D, 5877-94, 1992. Tononi G, Sporns O, Edelman G M. A measure for brain complexity: relating functional segregation and integration in the nervous system. Proc Natl Acad Sci U S A, 91 (11):5033-5037, 1994. Urbano A, Babiloni C, Onorati P, Babiloni F. Dynamic functional coupling of high resolution EEG potentials related to unilateral internally triggered one-digit movements. Electroencephalogr Clin Neurophysiol, 106 (6):477-487, 1998.
|