|
International Journal of Bioelectromagnetism Vol. 5, No. 1, pp. 316-317, 2003. |
www.ijbem.org |
|
BioPSE Case Study: Modeling, Simulation
and David M. Weinsteina, Joseph V. Tranquillob, Craig S. Henriquezb, and Christopher R. Johnsona aScientific Computing and Imaging Institute,University
of Utah, Salt Lake City, Utah, USA Correspondence: DM Weinstein, Scientific Computing and
Imaging Institute, University of Utah, 50 South Central Campus Dr, Rm. 3490, Abstract. The Bioelectric Problem
Solving Environment (BioPSE) is a flexible software architecture, specifically
designed for the interactive investigation of large-scale bioelectic field
problems. CARDIOWAVE is a high-performance software system designed for the
simulation of cardiac propagation. By bridging together the BioPSE and CARDIOWAVE
software systems, we have developed an integrated system for the modeling,
simulation, and visualization of three dimensional mouse heart propagation.
Keywords: BioPSE; CARDIOWAVE; Mouse Heart; Problem Solving Environment 1. Introduction The Bioelectric Problem Solving Environment (BioPSE) [Johnson et al, 1999] is a high-performance software architecture specifically tailored for the interactive exploration of bioelectric field problems. Released as an open source software system [BioPSE, 2002], BioPSE provides a large built-in palette of modeling, simulation, and visualization tools, as well as an underlying communication framework to allow formerly independent third-party software components to interoperate. Recently, we have integrated simulation components from the CARDIOWAVE software system (Duke University) [Pormann, 1999] with BioPSEs modeling and visualization algorithms, in order to simulate the propagation of cardiac activation through a mouse heart model. In this paper we describe the BioPSE dataflow programming environment; highlight the modeling, simulation, and visualization components used in this mouse heart project; and present preliminary results of this collaborative investigation.
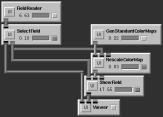
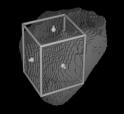
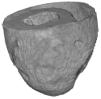
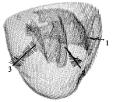
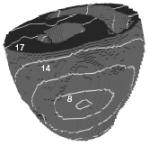
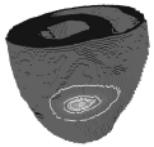
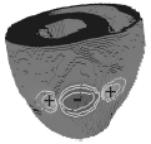
Figure 1.Programming, modeling, and visualization in BioPSE. In (a) we see a snapshot of the BioPSE dataflow programming interface. Users can interactively construct programs by instantiating modules, and passing input and output data between the modules through dataflow pipes. In this example we have built a small program for interactively changing the conductivity of specific regions of the mouse heart model in order to simulate ischemic regions, as shown in (b). In (c) we see a volume rendering of the MRI heart model data used in this study; in (d) we visualize the smooth rotation of the primary fiber orientations, as sampled through the ventricular walls. 2. Methods As shown in Fig. 1a, BioPSE provides a visual dataflow programming environment interface, allowing for the rapid development of bioelectric field applications. With dataflow, the programs data is passed from upstream modules to downstream modules through color-coded data-pipes. The modules provide a rich language of algorithms (e.g. model filters, finite element approximations, linear solvers, rendering methods, etc.), while the data-pipes control the flow of data between modules. For this study, we used a diffusion-weighted MRI scan of a mouse heart, scanned at 75-micron resolution. This model was pre-segmented during the conversion from diffusion-encoded channels to conductivity tensors [Hsu et al, 1998], resulting in a regularly gridded 1283 volume of measured diffusion tensors, where background voxels were tagged with null tensors. We imported this raw volume of data into BioPSE and clipped out the atria using an interactive tool like that shown in Fig. 1b. We then ran a connected-component algorithm to cull the ventricular cavities and the background from the myocardium. The resulting mouse heart model consisted of 225 236 nodes, as shown in the volume rendering (with the ventricular cavities excluded) in Fig. 1c. Exploring the local fiber structure of our model, we placed BioPSE virtual probes through the left and right ventricular walls. With these probes we sampled the fibers at regularly spaced intervals through the wall, and were able to verify the existence of smoothly rotating primary fiber orientations, as shown rendered in Fig. 1d. Having completed the geometric modeling of the data, we then used BioPSE to set up the simulation parameters. Specifically, we constructed a BioPSE dataflow network to: 1) reorder the nodes using the Cuthill-McKee algorithm to minimize matrix bandwidth; 2) interactively identify the stimulation site for pacing; 3) assign conductivity values throughout the domain; 4) construct the bidomain stiffness matrices for the hexahedral volume conductor model; and 5) save out the results as CARDIOWAVE input files. We then used CARDIOWAVE with a semi-implicit Crank-Nicholson scheme to simulate 100 ms of activation at 2.0 ms time steps. The propagation simulation required 6 hours of CPU time on 11 processors at the North Carolina Supercomputing Center. 3. Results Importing the CARDIOWAVE simulation results into BioPSE, the activation times and time-dependent voltage potential distribution are visualized on the epicardial surface. Fig. 2a shows the isochrone activation contours: activation was gated upon the upstroke reaching 60 mV; the entire heart took approximately 24 ms to activate. Fig. 2b shows the transmembrane potentials at 6.5 ms after stimulation; Fig. 2c shows the extracellular potentials at that same time instant.
Figure 2. Visualizations of mouse heart activation sequence: (a) isochrone contours (measured in milliseconds) of the activation wavefront; banded-shading and isopotential contour visualization of the transmembrane (b) and extracellular (c) potentials at 6.5 ms post-stimulus. References BioPSE: Problem Solving Environment for modeling, simulation, and visualization of bioelectric fields. Scientific Computing and Imaging Institute (SCI), http://software.sci.utah.edu/biopse.html, 2002. Hsu EW, Muzikant AL, Matulevicius SA, Penland RC, Henriquez CS.: Magnetic resonance myocardial fiber-orientation mapping with direct histological correlation. Am J Physiol Heart Circ Physiol 274: H162734, 1998. Johnson C, Parker S, Weinstein D, Heffernan S: Component-based, problem-solving environments for large-scale scientific computing. Concurrency and Computation: Practice and Experience 14: 1337-1349, 2002. Pormann J: A Modular Simulation System for the Bidomain Equations (PhD). Durham, NC: Duke University, 1999.
© International Society for Bioelectromagnetism
|