|
International Journal of Bioelectromagnetism Vol. 6, No. 1, pp. 67-73, 2004. |
www.ijbem.org |
|
Analyzing Time-Frequency Power Spectrum Limited Takeshi Tsutsumi, Daisuke Wakatsuki,
Hisa Shimojima, Yukei Higashi, Division of Cardiology, Showa University Fujigaoka Hospital, 1-30 Fujigaoka, Aoba-ku,
Yokohama, Correspondence: T Tsutsumi, Division of Cardiology, Showa University
Fujigaoka Hospital, 1-30 Fujigaoka, Aoba-ku, Yokohama, Abstract.
It is well known that the high frequency components during QRS complex may
relate with the scattered myocardial damages such as the focal necrosis.
However, the time-frequency power spectrum limited in QRS can be hardly measured
by use of the conventional fast Fourier transform (FFT) based algorithm. In
contrast to the FFT, the wavelet transform (WT) has time-widths adapted to each
frequency as window, which may help to solve the problem. Therefore we have
developed software for analyzing the frequency profile of QRS, and with it we
have tried to measure the latent myocardial damages. In this article, we also
give clinical significance explanations with proposed method. The electrocardiogram
(ECG) signals have been taken from some patients with intraventricular conduction
abnormalities (IVCA), with or without myocardial infarction (MI) and non-Q-MI or
Q-MI. The time dependence of the frequency powers spectrum is extracted by use
of Morlet wavelet of 40 scales. The time-frequency power spectrum during QRS and
the number of peaks of signals are calculated. The results have showed that the
power spectrum at the low frequency ( 100Hz) power is reduced in IVCA, comparing
with the normal cases. In IVCA with MI or MI, high frequency components were
shown increased. As our conclusion, WT is beneficial for the analysis of masked
frequency profile of QRS.
Keywords: Frequency Analysis; Wavelet Transform; Myocardial Infarction; Focal Necrosis
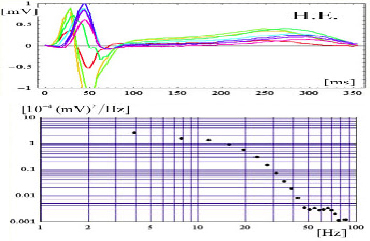
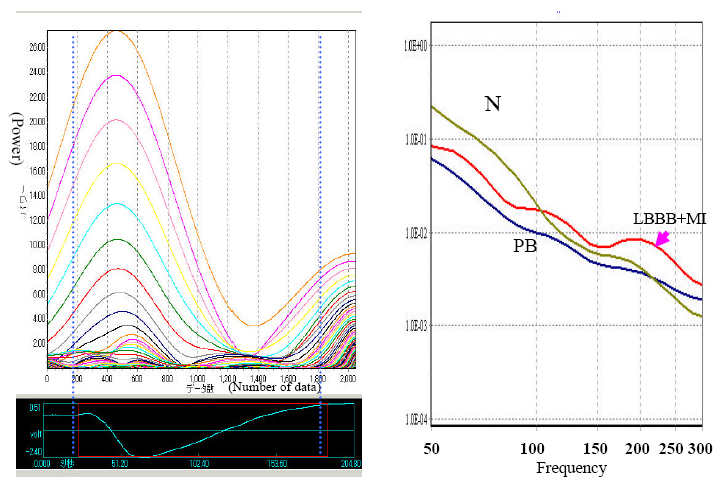
1. Introduction It has been known that frequency ranges of the normal 12-lead electrocardiograms (ECGs) usually concentrate to a band of 100 Hz or less, as shown in Fig. 1. However, over this band, the higher frequency components (200 Hz or more) during QRS complex were also noted since the work of Langner and Gezelowitz [Langner and Gezelowitz, 1961]. After that, Flowers et al. reported that the focal necroses in ventricular muscle of the heart of patients with dilated cardiomyopathy may relates the generation of such higher frequency components [Flowers et al., 1969]. Nevertheless, whether the higher frequency components provide significant information or not is still mysterious for electrocardiologists. Therefore, a further research is necessary in order for a realistic application. An effective frequency analysis method is required for such a research. The popular way of frequency analysis of the ECG signal has been the Fourier transform usually performed by the fast Fourier transform (FFT) algorithm. Since the wavelet transform (WT) uses wavelet functions that have time-widths adapted to each frequency as window, it is believed to be better than FFT for analyzing the time-frequency characteristics limited to QRS waves [Morlet et al., 1993; Zenda et al., 2001; Shimojima et al., 2003]. In this paper, we would like to evaluate the performance of a newly developed method based on the wavelet transform, when it is applied for the frequency power spectrum during the QRS of patients with an abnormality such as the myocardial infarction (MI), the bundle branch block or the paced beat (IVCA; intraventricular conduction abnormalities) with or without MI.
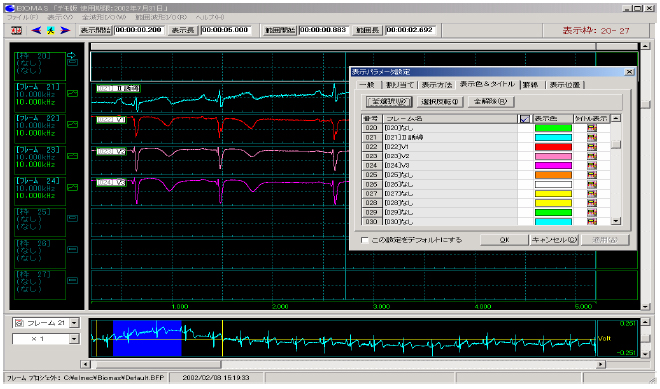
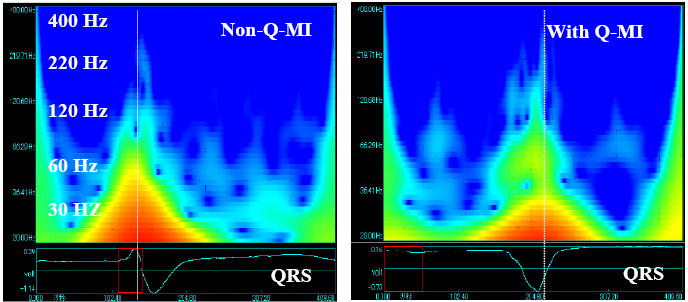
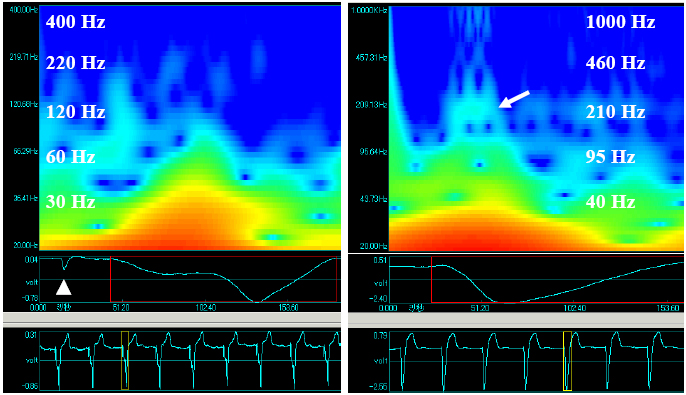
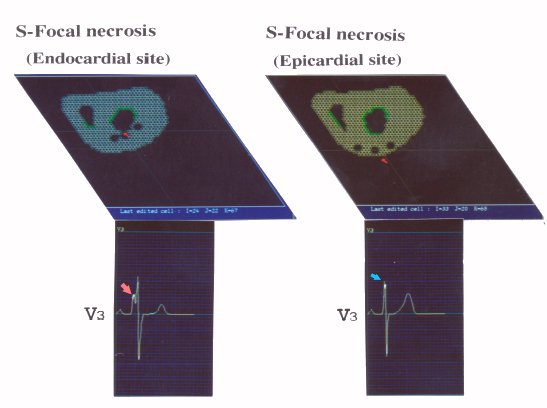
Figure 1. Superimposed Standard 12-lead ECGs in the upper panel and in the frequency distribution of ECGs by FFT method in the lower panel. 2. Materials and Methods The recording equipment consists of an electrocardiograph (Cardio-Multi, Fukuda Dennsi Co., Ltd., Tokyo, Japan) and an A-V converter connected to a mobile personal computer (PC). The standard 12 lead ECGs are recorded from normal volunteers (n=12) and the patients with abnormality such as the anterior MI (n=6), the IVCA (n=6) or the IVCA together with MI (n=6), under the conditions of filter off and sampling rate of 10 kHz, in an electrically shielded room. These signals are input into Microsoft Windows based PC and saved as binary files. We have developed a piece of PC software for analyzing the frequency profile of ECGs by using the PC based wavelet transform software (BIOMAS, Version 1.0ß) provided by Elmec Co., Inc., Tokyo, Japan. 3. Results The PC screen capturing of ECG signals is shown in Fig. 2. The time series of the signal powers in each band with the frequency from 10 Hz to 400 Hz was obtained with 40 scales. Figure 2. Captured electrocardiograms on computer screen. Sixteen channels are used in the present research and the color of ECG trajectory can be chosen as one like. Figure 3. Contour of wavelet transformed signals for the ECG (V3) of patients with the myocardial infarction. In the figures, the terms Non-Q-MI denotes the non-Q wave myocardial infarction, and Q-MI denotes the Q wave myocardial infarction. The representative contours of wavelet transformed signals for the patient with anterior MI are illustrated in Fig. 3. One QRS complex was selected from the continuous recording of the chest lead (V3) and it was analyzed with the wavelet transform, and then the wavelet transformed signals were shown in the main window. Eight kinds of mother wavelets can be used in this software. The Morlet wavelet was applied in this research. The vertical axis shows the frequency and the horizontal axis shows the passing time. The magnitude of the frequency power was expressed as a color ranging from red to blue. Both in non-Q-MI and Q-MI cases, the fine higher frequency power distribution can be confirmed. In the case with MI, the low frequency (100Hz or less) region of the power distribution shown as red zone decreased in an order of the normal case > the non-Q-MI case > the Q-MI case. The appearance time of the peak power indicated as a dotted white line was at the early part of QRS in non-Q-MI case, while it is at the middle part of QRS in Q-MI case. Figure 4. The contour of wavelet transformed signals was obtained from the right ventricular pacing beat in the left panel and they were obtained from the left bundle branch block with the anterior myocardial infarction in the right panel. In general, it is difficult to diagnose MI in the case with IVCA. The time-frequency analysis may help to solve this problem since it can detect the independent abnormal excitation sequence due to the focal necrosis of MI. We tried to examine this point in the cases of MI with and without IVCA. The examples were illustrated in Fig. 4. The left panel in Fig. 4 shows the wavelet transformed signal from the patient treated with the implantation of permanent pacemaker in which the cardiac excitation is generated by right ventricular pacing. The patient did not complicate by MI, according to other clinical examinations. The white triangle indicates the pacing pulse. The higher frequency power can be hardly seen between QRS in this case. The right panel shows the wavelet transformed signal from the patient of the left bundle branch block (LBBB) with the anterior MI simultaneously. The higher frequency power is clearly observed in the early phase of the QRS indicated by the arrow. Figure 5. Two dimensional representation of wavelet transformed signal between QRSs, in left panel, and the averaged areas of every wavelet transfored signal vs. Frequency, in right panel. In these panels, N, LBBB+MI and PB denote the results of the normal cases (n=12), the myocardial infarction case, (n=6), and the paced beat case, respectively. The two blue vertical dotted lines in the left panel indicate the integral time window corresponding to the QRS wave. In order to evaluate the magnitude of the wavelet transformed signal quantitatively, a further analysis of data was introduced. As shown in the left panel of Fig. 5, the two dimensional representation of the relation between the magnitude of the signals and the passing time was illustrated. The areas of the signals between two optional phases of QRS could be obtained in every time-frequency power corresponding to the 40 scale bands. Once these calculated values had been stored into PC in the CSV file format, the numerical lines consisting of 40 values in the file were copied. We pasted it into Window based Excel sheet and then performed the statistical analysis for all the subjects. The results are illustrated in the right panel of Fig. 5. In the panel, the average area in every frequency band during the QRS has been shown. The areas in the case with IVCA together with the anterior MI significantly increased within the frequency range of 200-250 Hz in contrast to that with the paced beat. 4. Conclusions In order to build the relationship between the focal necroses and the fine notches on QRS, three cylindrical shaped necrotic lesions (r=2mm) were simulated by the Aoki-Wei model [Wei, 1997]. The necrotic cells were simulated by incorporating the unit cells with the electrically null. In the model of necrotic lesions located in the endocardial site of the left ventricular wall, as shown in the left panel of Fig. 6, the larger notches were simulated in the former half of the QRS wave (V3). In contrast to this, the fine notches were in the middle part of the QRS in the model of necrotic lesions located in the epicardial site, as shown in the right panel. These results may strongly depend upon the spatial localization between the necrotic cell and the Purkinje network from which the ventricular excitation started. The results of this simulation indicate that the focal small necrosis may be relevant to the generation of higher frequency components. Consequently, it was speculated that the time dependent deformation of the shape of excitation front passing through the small necrotic lesions (1~2 mm; od) will be a cause of the generation of the higher frequency components. Note that the information given from this analysis is independent of the change in the excitation sequence in the case of IVCA, which can not be detected from the configuration of the standard electrocardiographic wave forms. Figure 6. Simulated focal necrosis and QRS waveform by use of the Aoki-Wei model.
Acknowledgements We express thanks to Prof. Okamoto and Prof. Wei for helpful technical supports and comments to this research. References
Flowers NC, Horan LG, Thomas JR and Tolleson WJ. The anatomical basis for high-frequency components in the electrocraiogram. Circulation XXXIX: 531-539, 1969. Langner PH, Geselowitz DB and Mansure FT. High-frequency components in the electrocardiogram of normal subjects and of patients with coronary heart disease. Am Heart J. 62: 746-755, 1961. Morlet D, Peyrin F, Desseigne P and Rubel P. Wavelet analysis of high-resolution signal-averaged ECGs in postinfarction patients. J Electrocardiol 26: 311-320, 1993. Shimojima H, Tsutsumi T, Yanagisawa F, Komukai M, Zenda N, Higashi Y, Takeyama Y and Okamoto Y. Application of wavelet transform for analysisof QRS complex in intraventricular conduction abnormalities. Inter J of Bioelectromag 5(1):279-281, 2003. Wei D: Whole-heart modeling. Progress, principles and applications. Prog Biophyss Molec Biol 67: 17-66, 1997. Zenda N, Tsutsumi T, Sato M, Takeyama Y, Harumi K and Wei D. Computer simulation of notches on initial part of QRS complex in patients with anterior myocardial infarction, in 2000 Electrocardiology. Ambroggi LD, Editor. Casa Editrice Scientifica Internazionale, Roma, 2001, 117-120.
|