|
International Journal of Bioelectromagnetism Vol. 5, No. 1, pp. 107-108, 2003. |
www.ijbem.org |
|
Finding of ROI Intervals at Cardiocycle for CAD Study in Magnetocardiography Mykola Budnyka, Tayisa Berezovskab, Olexander Kovalenkob, Victor Kozlovskyc aGlushkov Institute for Cybernetics, NAS of Ukraine, Kyiv, Ukraine Correspondence: M Budnyk, Glushkov Institute
for Cybernetics, NAS of Ukraine, P.O. Box 03680, Kyiv-187, Ukraine. Abstract. Aim
of work is to find cardiocycle intervals consisting diagnostic significant information
to detect CAD. Such region-of-interest (ROI) intervals are estimated with help
of six figures having a sense of normalised distances determined between magnetic
map-templates for healthy and CAD pts. It was obtained, that there are 3 ROI
intervals, in which most of distances have a maximum. Such peaks show that maximal
amount of new information of CAD in comparison with Norma takes place.
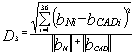
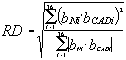
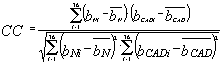
Keywords: Magnetocardiography; Magnetic Maps; Cardiocycle Intervals; Diagnostic of CAD; Distance in Vector Space 1. Introduction Magnetocardiography (MCG) is a method of non-invasive recording and analysis of the magnetic field of the heart, arising due to its electrical activity. The one of the advantages of the MCG-mapping is possibility of the myocardium electrical activity source localization [Malmivuo and Plonsey, 1995]. Well-known, that CAD is the most widespread heart disease, so MCG is tested as a method for CAD screening. STT segment (J-T max) that reflects the ventricle repolarization is considered mainly for CAD study [Chaikovsky et al, 2000; Kozlovsky et al, 20002]. Are another time ROI intervals suitable for CAD determination? In general, which peaks/segments of cardiocycle are useful for specific heart disease diagnosis? Hence, the aim of the research is to find above ROI for CAD determination and perform an algorithm for other heart diseases. 2. Material and Methods ROIs are defined as the time intervals with maximum distances between magnetic map-templates for given pathology and Norma. We used six general distances D1-D6 described by Eq. 1-3. Here n=36 is number of spatial points. Distances D1-D4 suppose map as vector and D5&D6 assume map as matrix. Distance D1 is proportional to angle into vector space; D2&D4 are normalised absolute distances, D3 is normalised Euclidean one. Values D5&D6 have used before [Fischer et al, 2002] for estimation of difference (RD) and similarity (CC) between two maps, respectively. All distances are normalised within the range 0-1 and applied for calculation of Norma-CAD difference.
where bNi & bCADi magnetic field value for i-th spatial point for normal and CAD map-templates | . | & || . || absolute field value and Euclidean norm of magnetic map —— arithmetic-mean-average value of magnetic field over whole map. 3. Results MCG was performed by 1-channel device MCG1 (SQUID AG, Essen, Germany) based on pulse-relaxation SQUID-magnetometer developed at Glushkov Institute for Cybernetics (Kyiv) and used at Strazhesko Institute of Cardiology (Kyiv) at unshielded environment. The measurement was executed in 6X6 points of rectangle grid (4 cm pitch) during 1 min in each point [Budnyk et al, 2002]. The whole cardiocycle was analyzed with the help of 500 maps and all distances (Eq.1-3) were calculated between CAD and healthy. 86 persons were examined: 44 healthy (19males/25females, 44±14) and 42 CAD pts (32 males/10 females, 58±10) with unchanged rest ECG. Clinical examinations, ECG, Echo-CG, angiography, bicycle test were executed also. Fig. 1 presents all distances for whole cycle. All distances (except D6) are sensitive to changing of MCG (and ECG) during cardiocycle, D6 recognises only R-peak. D4&D5 are noisy and have small deviation. As a result, only D1, D2 and D3 can be used for difference estimation between CAD and healthy maps. Value D1 has the most deviation, hence, should be preferably used. 
Figure 1.
Results of analysis for whole cardiocycle: A) changing of all distances; B) reference ECG.
4. Discussion The present study shows six monotonous-slope ROIs that are the most informative with respect to CAD. Above intervals should be used to find the new MCG indexes for CAD diagnosis. The one from ROI, STT interval with monotonous decreasing of distances, in fact, have been used before for CAD study [Chaikovsky et al, 2000; Budnyk et al, 2002; Kozlovsky et al, 2002]. Fig. 2A presents method for exact determination of the CAD ROI borders for studying of the ventricular repolarization abnormality (marked by vertical lines at Fig.1a). Peak at J-point reflects the non-homogeneity of ventricular repolarization, minimum at the T-wave is explained by convergence of both CAD&healthy maps to dipole-like pattern. Acknowledgements This work has been supported from Science&Technology Center in Ukraine (STCU), grant 2187. References Budnyk M, Chaikovsky I. Kozlovsky V, Primin M, Sosnytsky V, Stadnyuk L, Voytovych I. Diagnostic criteria for chronic ishemic heart disease based on registry and analyses of the magnetocardiograms. Institute for Cybernetics, Kyiv, 2002. Chaikovsky I, Steinberg F, Hailer B, Hecker Th, Budnyk M, Auth-Eisernitz S. Possibilities of MCG in CAD detection in pts with normal or unspecifically changed ECG. In proceedings of the 3rd Intern. Congress on CAD, Lyon, 2000, 415-421. Fischer G, Seger M, Modre R, Hanser F, Messnarz B, Tilg B, Berger T, Schoke M, Kremser C, Hintringer F, Roithinger F. A comparison og finite elements and boundary elements applied to bidomain model based lead-field matrix computation, In proceedings of the 13th Intern. Conf. on Biomagnetism, 2002, 749-751. Kozlovsky V, Budnyk M, Stadnyuk L, Dmytriyeva T, Voytovych I, Rekovets O, Getman T. Registration and processing of magnetocardiograms for patients with CAD, In proceedings of the 13th Intern. Conf. on Biomagnetism, 2002, 576-578. Malmivuo J, Plonsey R. Bioelectromagnetism: Principles and Application of Bioelectric and Biomagnetic Fields. OxfordUniversity Press, New York, 1995.
© International Society for Bioelectromagnetism
|