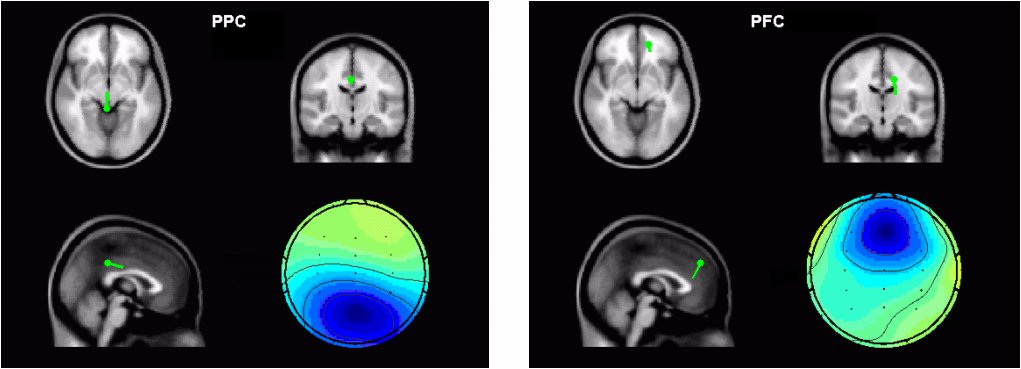
Figure 2. Typical scalp map and corresponding dipole location of a PPC component (left) and a PFC component (right) from the crossmodal matching task of one subject. Scalp maps are shown in color, while the averageMRI head model are shown in gray scale with green dipoles superposed on it, which were produced in EEGLAB [Delorme and Makeig, 2004]. |