|
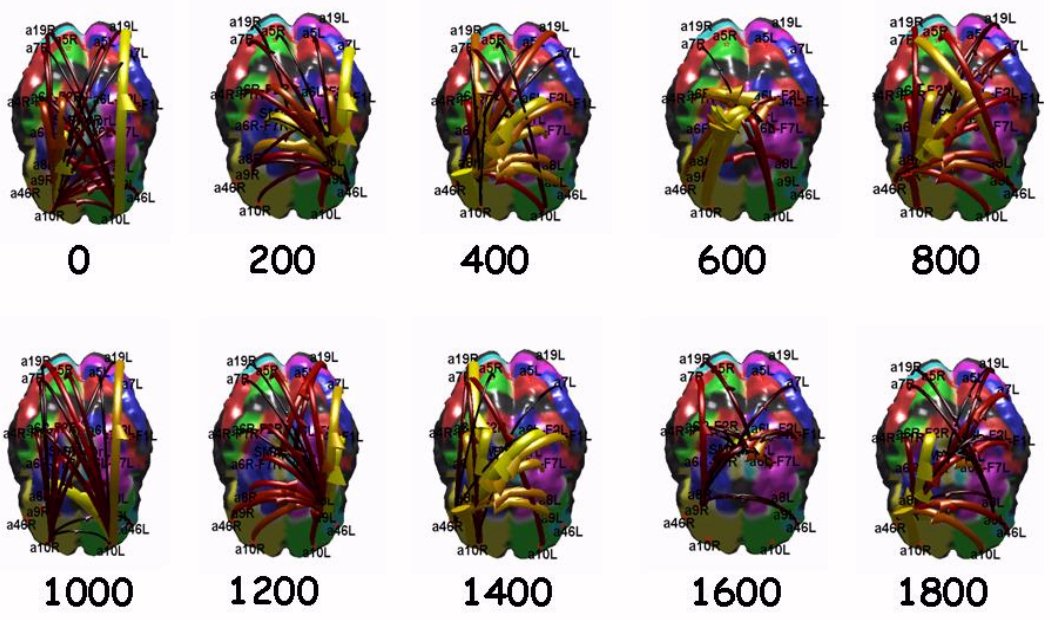
Figure 5. Sequence of functional connectivity patterns estimated by using the DTF on the grand average data for the population performing the Encoding long term memory task. The connectivity has been computed in the theta frequency band. The cortex is seen from above, nose at the bottom, left ear to the right. The number under each map represent the ms from the stimulus presentation (see Fig. 2 for the task description). Labels on the maps code the ROIs interested in the analysi, the label R means right cortex, the label L mean left cortex. Then, A19L means Brodmann area 19 in the left hemisphere.. A functional link between two ROI is represented as an arrow, with a size and color according to the intensitity of the causality flows between the two regions. The lighter the color of the arrow the stronger is the connection estimated from the ROIs. Only the statistical significant link at p<0,001 between cortical ROIs are represented here. |