|
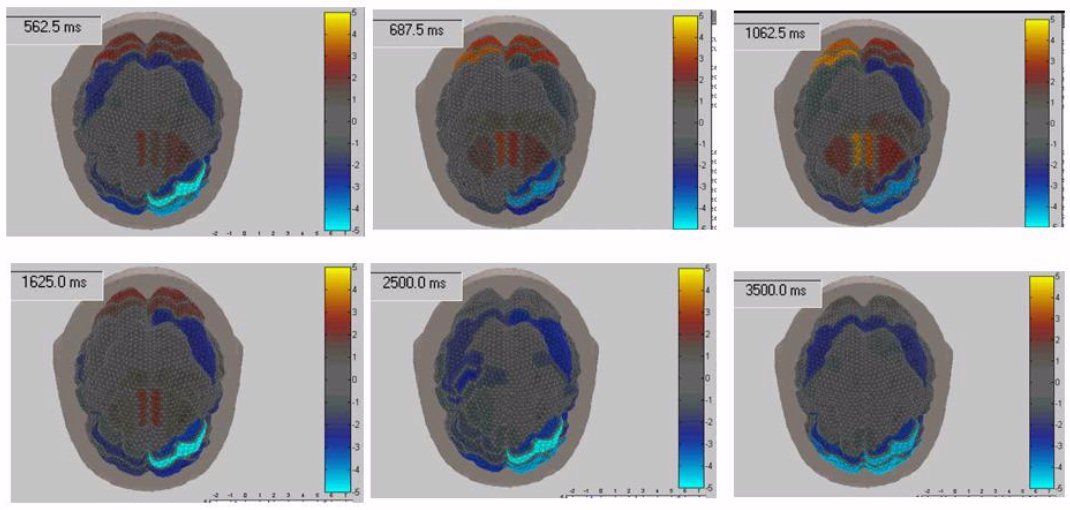
Figure 4. In this figure the Significance Parametric Mapping (SPM) is presented for the grand average of all the subjects that were subjected to the Long Term Memory task, in the part of the Encoding of pictures. The SPM data presented are relative to the time period from about 500 ms to 3500 ms after the stimulus presentation and are referred to the theta frequency band. The head is seen from above, the nose at the bottom, left ear at the right of the each head. The colour bar has the same significance described in the figure 3, i.e the z score that exceeds the threshold for the statistical significance required is coded with a hue from yellow to red (in the present case up to a value of z equals to 5, that it is associated to a statistical significance of p<10-5), while decrement of spectral power in a particular ROI statistically significant are presented with a negative value of the z score coded with a hue from dark to the light blue (z = -5). |