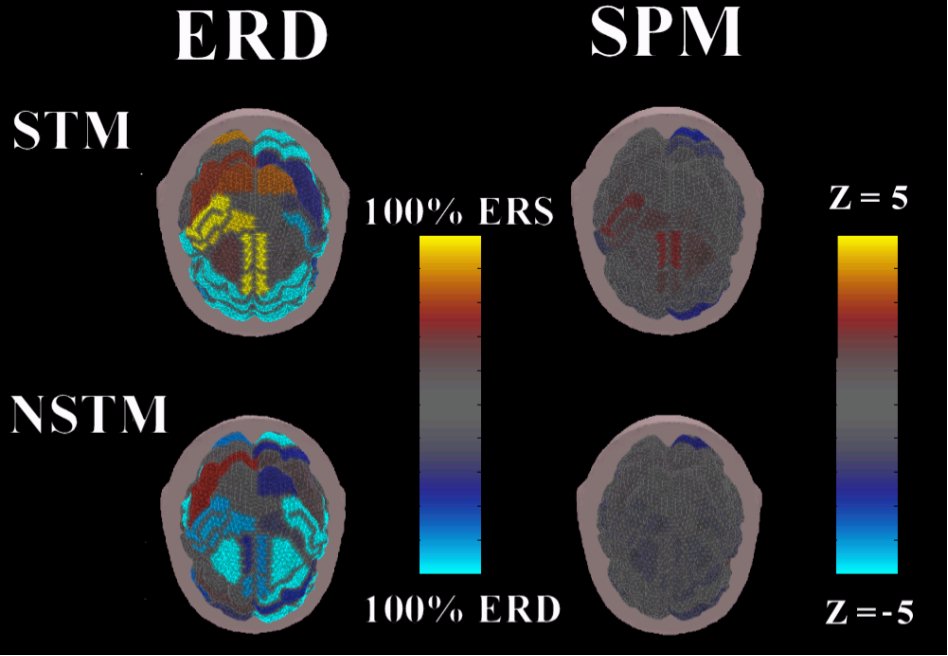
Figure 3. First column left: Estimated cortical distributions, obtained by the solution of the linear inverse problem in the spectral domain associated with the gathered EEG data for the Short Time Memory (STM) and No Short Time Memory (NSTM). Figure presents the grand average data of the EEG recorded population relative to the variation of cortical current density power in the theta frequency band. Increasing values of spectral power with respect to the baseline period (ERS) are represented from yellow to red hues, while the decreasing values of spectral power (ERD) are coded from the dark to the light blue. The upper cortical distribution is relative to the STM task while the bottom one presents data estimated during the NSTM task. Spectral maps are relative to the time period of 1.5 seconds from the beginning of the delay period. The head is seen from above, nose down, left ear at the right of the visualized head. |