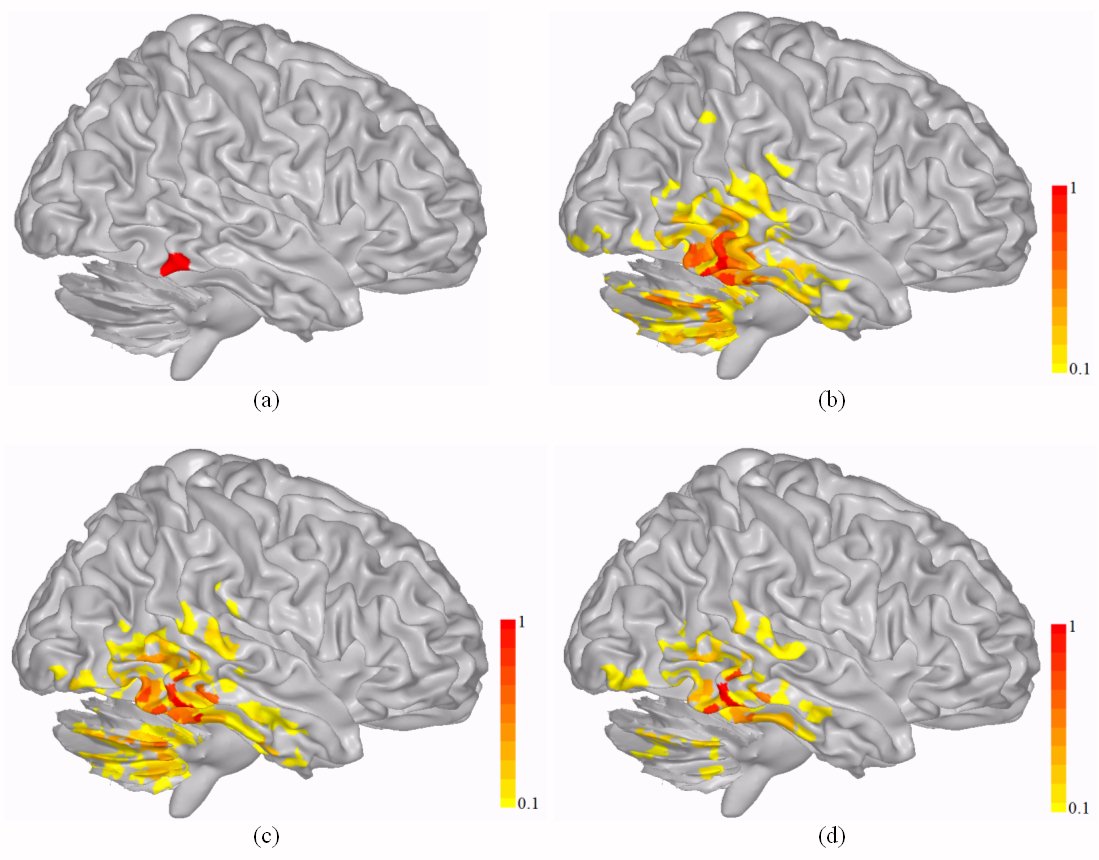
Figure 5. Results of a realistic EEG simulation – a patch was assumed around right inferior temporal lobe: (a) Exact patch location; (b) Source distribution of (Case 1); (c) Source distribution of (Case 2); (d) Source distribution of (Case 3). All quantities were normalized with respect to their own maximum value. Sources that exceed 0.1 are visualized. SNR = 7 dB. DF values of (b), (c), and (d) are 0.081, 0.083, and 0.184, respectively. |