(a)
(b)
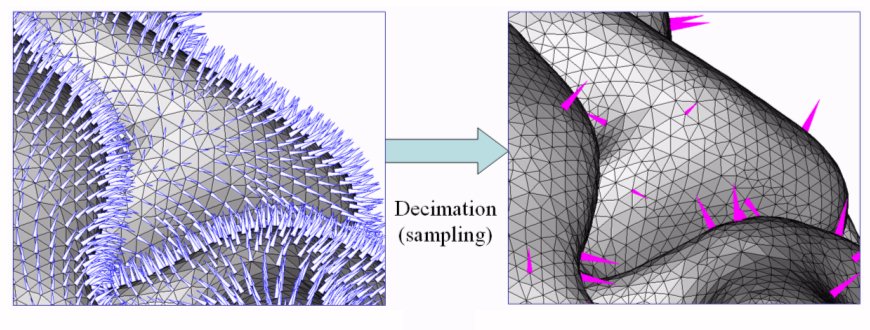
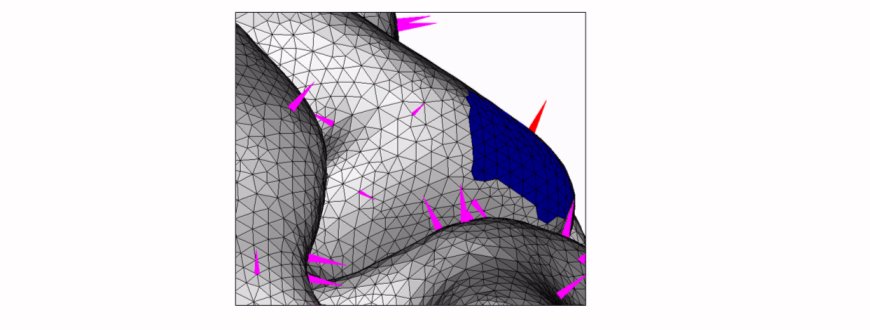
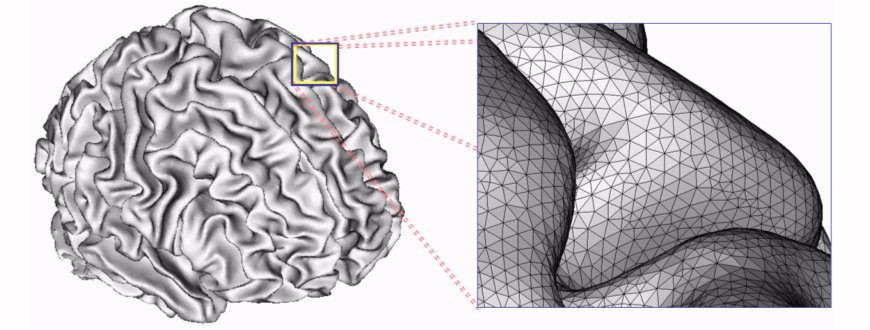
(c) Figure 1. An example of tessellated cortical surface and decimated sources: (a) cortical surface segmented and tessellated from an MRI T1 images (MNI standard brain); (b) original and decimated cortical vertices. 432,654 original vertices were reduced to 7,866 source positions; (c) area-of-influence around a decimated source (red vector). The orientation was determined by the vector sum of all vertices inside the patch. |