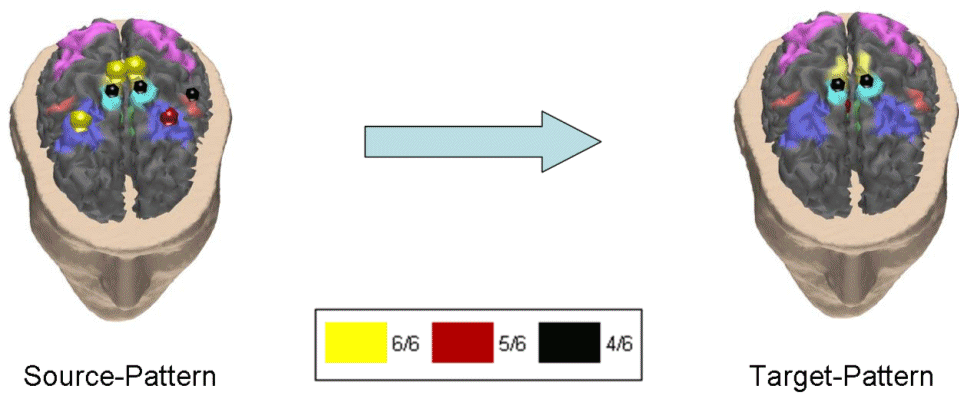
Figure 6. Second average cortical causality pattern between the independent spatial componenst in the theta frequency band. Correlation between subjects was 72%. Same conventions are used as in the previous figure. Note that the red sphere in the right cyngulate area in the target cortical pattern (on the right) is almost completely hidden from the cortical surface in the realistic reconstruction of the cortex presented here. |