 |
International Journal of Bioelectromagnetism Vol. 5, No. 1, pp. 309-311, 2003. |
www.ijbem.org |
|
The U Wave in the ECG: A New View on its Genesis Henk J Ritsema
van Eck, Jan A Kors, and Gerard van Herpen Department of Medical Informatics, Erasmus MC, The Netherlands Correspondence: HJ Ritsema van Eck, Department of Medical Informatics, Erasmus MC, P.O. Box 1738, 3000 DR Rotterdam, The Netherlands. E-mail: h.ritsemavaneck@erasmusmc.nl, phone +10 408 7050, fax +10 408 9447 Abstract. In the electrocardiogram (ECG)
the U wave is the deflection that follows the waves of depolarisation (QRS)
and repolarisation (T) of the heart chambers. Its polarity is normally the
same as that of the T wave. We present a simple digital model, which explains
the formation of the U wave on the basis of known electrophysiological processes
responsible for the electrical sources in the myocardium, and of the physical
laws, embodied in the lead vector concept, which link the potentials in or
on the body to these sources.
Keywords: U Wave; Myocardial Repolarisation; Lead Vectors 1. Introduction Einthoven [Einthoven, 1906] was the first to describe the U wave almost 100 years ago. A satisfactory explanation of its origin is still outstanding. The three most frequently quoted hypotheses about the underlying mechanism are (1) the late repolarization of the subendocardial Purkinje fibres [Hoffman and Cranefield, 1960], (2) the prolonged repolarization characteristic of the M-cells in the mid-myocardium [Antzelevitch and Sicouri, 1994] and (3) after-potentials [Di Bernardo and Murray, 2002] caused by mechanical forces in the ventricular wall [Surawicz, 1998]. However, none of these hypotheses has received general acceptance [Wu et al., 2002]. 2. Material and Methods The model consists of a myocardial element of multiple layers: one layer representing the endocardium, 10 layers representing the mid-myocardium, and one layer representing the epicardium. Each layer consists of an assembly of a given number of identical cells. Presuming a layer thickness of 1 mm, the model stands for a small segment of the ventricular wall of 1.2 cm thick, in which the mid-myocardium is sandwiched between endocardium and epicardium. An action potential (AP) is assigned to each individual cell assembly based on the model proposed by Wohlfart [Wohlfart, 1987]. The parameters controlling AP duration and terminal slope (phase 3) in this model were varied in order to modify the shape of the AP. The timing of the APs is such that the endocardial layer starts first, followed by the mid-myocardial layers and the epicardium, thus simulating ventricular wall activation from inside outwards. Fig. 1 shows the APs as they were constructed for endocardium, myocardium and epicardium. Figure 1. Action potentials assigned to endocardium, mid-myocardium and epicardium. The marker at 350 ms coincides with AP90 of the endocardium. At the endocardium the action potential duration at 90% repolarisation (AP90 ) is 350 ms, at the epicardium it is 342 ms. The mid-myocardium is known to contain a certain proportion of M cells with prolonged repolarization. For the sake of convenience we gave all 10 mid-myocardial layers M-cell characteristics. Their AP90 values range from 382 ms (subendocardial) over a maximum of 420 ms to 358 ms (subepicardial). These figures are in keeping with the AP durations reported for human myocardial APs [Drouin et al, 1995]. The model premises that a current source is generated between each pair of adjacent myocardial layers, the strength of which is given at each time instant by the potential difference between their APs, as they appear in Fig. 1. The sources are assigned to the interfaces between the myocardial layers and are presumed to be perpendicular to these surfaces, thus forming the dipole source vectors D1, , D11 (the 12 cell layers giving rise to 11 boundaries). A potential will be generated in a given point P in or on the body by each dipole source. This potential is a function of the strength of the dipole D. The function is determined by the geometrical position of P relative to the location of D and by the electrical properties of the interposed tissues and is expressed by the lead vector L of P with respect to D:
where α is the angle between D and L. Each dipole has its own lead vector and will, therefore, make a differently weighted contribution to VP. The closer P is to the source D, the larger L tends to be; in addition, VP is maximal for α = 0, but zero for lead vectors perpendicular to the dipole axis. 3. Results Let us first assume that all lead vectors are of equal strength and point in the same direction as the sources (i.e., cos α = 1). The calculated VP follows the pattern of Fig. 2a, which electrocardiogram can be described as a biphasic T wave. 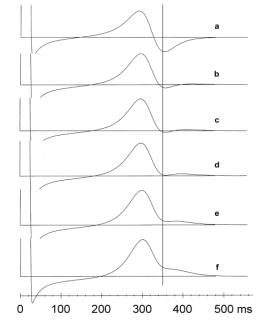 Figure 2. Computed repolarisation patterns in point P: (a) Equal lead strengths for all layers; (b-f) Differential lead strengths. The distance of P to the epicardium is varied from 8 cm (b) to 4 cm (f) in 1 cm steps. The vertical marker is at 350 ms, as in figure 1. However, the lead vectors are not of equal strength since they are dependent on the location of the exploratory point P in relation to the sources in the myocardium. The thickness of the ventricular wall (12 mm in our model) is not negligible in relation to the distance between the epicardium and the electrode locations on the body surface, in particular the chest leads. In a homogeneous infinite conducting medium the lead strength is inversely proportional to the square of the distance of the source to the measuring point. Figures 2b to 2f illustrate the effect of varying the distance of P to the epicardium on the appearance of the U wave. At 8 cm (Fig. 2b) the lead strengths increase exponentially from 1 to 1.26 from endocardium to epicardium, assuming P in the axis of the dipoles (α = 0°). The terminal part of the repolarisation appears isoelectric. At smaller distances this terminal part is seen to rise. At 6 cm (lead strengths from 1 to 1.35), there is an unmistakable U wave (Fig. 2d). At 4 cm (lead strengths from 1 to 1.53) the prominent U wave of Fig. 2f arises. 4. Discussion With equal lead vectors at any time instant the voltage at P is the sum of all dipole strengths |D1|, , |D11|, times a constant. These strengths are determined, with a certain common proportionality factor, by the potential differences between each pair of adjacent APs. Thus, VP follows from (AP1-AP2) + (AP2-AP3) + + (AP11-AP12), which simply reduces to AP1AP12. Consequently, without lead differentials a body surface potential will only show the differences between endocardial and epicardial potential course. Unless the endo- and epicardial repolarisation curves are of very unusual appearance their differences will not result in the double-humped deflection that ECG tradition has taught us to label as a separate T wave and U wave. If, on the other hand, lead vector differences are applied, the divergence in AP durations of the mid-myocardial layers is not nullified and a U wave appears. As Antzelevitch and coworkers [Antzelevitch and Sicouri, 1994; Nesterenko and Antzelevitch, 1992] proposed it is the delayed repolarization of the M cells that is a condition for the appearance of the U wave, but it requires lead vector differentials to actually produce them. The larger the lead vector differentials, the more conspicuous the U waves, such as in the central chest leads. The differential lead vector model as presented here gives a different meaning to the definition of the end of the T wave. Fundamentally there is a continuum between T and U. What is generally regarded as the end of T coincides more or less with the end of endocardial repolarisation. The repolarisation of the bulk of the myocardium is only completed at the end of U. T and U together are the resultant of the same process, i.e., the total repolarisation of the ventricular myocardium. This means that our ideas about QT duration and prolongation, whether drug-induced or congenital, have to be reassessed and that the approach to drug safety testing will need to be reconsidered. References Antzelevitch C, Sicouri S. Clinical relevance of cardiac arrhythmias generated by afterdepolarisations. Role of M cells in the generation of U waves, triggered activity and torsades de pointes. Journal of the American College of Cardiology, 23, 259-277, 1994. Di Bernardo D, Murray A. Origin on the electrocardiogram of U-waves and abnormal U-wave inversion. Cardiovascular Research, 53, 202-208, 2002. Drouin, E., Charpentier, F., Gauthier, C, Laurent, K. & Le Marec, H. Electrophysiological characteristics of cells spanning the left ventricular wall of human heart: evidence for the presence of M cells. Journal of the American College of Cardiology, 26, 185-192, 1995. Einthoven W. Le télécardiogramme. Archives International de Physiologicue, 4, 132-164, 1906. Hoffman BF, Cranefield PF. Electrophysiology of the Heart. McGraw-Hill, New York, 1960. Nesterenko VV, Antzelevitch C. Simulation of the electrocardiographic U wave in heterogeneous myocardium: effect of local junctional resistance. In proceedings of Computers in Cardiology, 1992, 43-46. Surawicz B. U wave: facts, hypotheses, misconceptions, and misnomers. Journal of Cardiovascular Electrophysiology, 9, 1117-1128, 1998. Van Dam RT, Janse MJ. Activation of the heart, in Comprehensive Electrocardiology. Macfarlane PW, Lawrie TDV, Editors. Pergamon, New York, 101-128. Wohlfart B. A simple model for demonstration of ST-T changes in ECG. European Heart Journal, 9, 409-416, 1987. Wu J, Wu J, Zipes DP. Early afterdepolarisations, U waves, and Torsade de Pointes. Circulation, 105, 675-676, 2002.
© International Society for Bioelectromagnetism
|

