|
International Journal of Bioelectromagnetism Vol. 5, No. 1, pp. 252-253, 2003. |
www.ijbem.org |
|
Model Study of Assessment of Local
Heart M. Tylera, V. Szathmáryb,
and M. Turzováa aInstitute of Measurement Science, Slovak Academy
of Sciences, Bratislava, Slovakia Correspondence: M Tyler, Institute of Measurement Science, Slovak Academy of Sciences, Dúbravská cesta 9, 841 04 Bratislava, Slovakia. E-mail: umertysl@savba.sk, phone +421 2 5477 5950, fax +421 2 5477 5943 Abstract. Assessment of repolarization
changes by several ECG methods was studied. A computer model was used to simulate
local heart repolarization and to compute corresponding surface ECG. From
computed heart vector limited information on repolarization changes could
be obtained and their localization was difficult. Changes were clear visible
in surface activation-recovery intervals maps but their position was incorrect
in some cases if the changes were large. The most reliable identification
and localization of repolarization changes was obtained from body surface
integral maps.
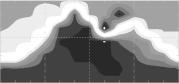
Keywords: ECG Modeling; Heart Repolarization; Heart Vector; Body Surface Potential Mapping; Surface ARI Mapping 1. Introduction Ventricular repolarization and its expression in the ST-T part of the ECG signals are closely related to the shape of action potentials (AP) of myocardial cells. Differences between AP shapes in the endo- mid- and epicardial layers and distribution of AP duration through the ventricular walls are important for resultant repolarization and its projection into ECG signals. In this study we employed linear and realistic shapes of AP and simulated heart repolarization with local changes of AP duration. Corresponding surface ECG potentials were computed to estimate the ability of selected ECG-based methods to detect small repolarization changes in areas of various sizes and in different heart locations. 2. Material and Methods A finite element model of heart ventricles was employed to simulate cardiac depolarization and repolarization [1]. Up to five layers with different AP characteristics were defined in ventricular walls and in the septum. Piecewise linear AP shape, one realistic AP shape or specific AP shapes for endo- mid- and epicardial layers as measured in canine left ventricular wedge preparation [2] were adopted. In all simulations, character of experimentally observed transmural distribution of AP duration was preserved and its transmural dispersion was about 40 ms. Multiple dipole with 168 dipoles was used to represent the cardiac electric generator. Boundary element method was employed for computation of electric potentials on the surface of an inhomogeneous torso model. Computed heart vector, Frank VCG, body surface potential maps, integral maps and surface distribution of activationrepolarization intervals (ARI) [3] were analyzed. Normal (reference) ventricular repolarization and repolarization with locally changed AP duration were simulated. AP was shortened by 10 to 25% of the reference value in three regions: anterior LV near apex, postero-lateral LV close to heart base and mid-lateral RV. Subendocardial and transmural regions with sizes representing from 1% to 16% of the ventricular volume were modeled. 3. Results Acceptable simulated surface potentials were obtained for all three AP shapes. Piecewise linear AP shapes produced rough approximation of T waves in ECG signals with preserved main features. More realistic data were obtained if one or three different realistic AP shapes in ventricular layers were used. Local changes of AP duration influenced the heart vector in dependence on their magnitudes. The relatively small changes were indicated as deviations of heart vectors from the reference. These deviations may contain information about the extent and localization of the region with changed AP. In most cases, local AP changes were clearly visible in surface ARI maps. This was true namely for medium and large sized regions. However, especially for AP changes bigger than 10%, positions of changed area in ARI maps did not correspond to the region of the changed AP. The most reliable identification and localization of repolarization changes were obtained from body surface integral maps. Regions with changed AP were projected to areas of changed integrals that appeared in expected locations on the torso surface. Though flatter, properly located changed integral map areas were visible also for AP changes in postero-lateral LV regions of medium to large size. In Fig.1 is an example of simulated normal data and data obtained if AP was shortened by 10% in a medium sized (6% of volume) antero-septal transmural region in the LV. In the heart vector, T wave decrease and shape change is visible in HVx and HVz. In integral map, AP shortening is projected as decrease of the QRST integral on the near-by left anterior and partially also posterior torso surface. In surface ARI maps, shortening of ARI intervals is visible nearly in the same part of the torso surface.
Figure 1. AP shortening in antero-septal LV region projected into heart vector orthogonal components HVx, HVy, HVz ((left, full line is the reference), surface QRST integral maps (middle, reference map in the top) and ARI maps (right, reference map in the top). 4. Discussion and Conclusions Careful adjustment of AP duration and other AP characteristics was necessary to obtain realistic simulated potentials. Limitation of the model is the use of isotropic myocardium. This may cause inaccuracy of simulated potentials that should be considered when interpreting the results. The results indicate that limited information about relatively small AP changes and their localization can be obtained from the heart vector or from surface VCG. Multi-lead methods perform better. Repolarization changes were clearly visible in surface ARI maps but this method does not guarantee their correct localization. The most reliable identification and localization of regions with changed repolarization was obtained from body surface integral maps. Because of the limitations of the model, validity of the obtained results has to be verified on real data. Moreover, in real situations, changes of surface potentials caused by locally changed repolarization can be masked by other physiological fluctuations and noise in measured data. Acknowledgements This work was supported by grants 2/1135/23 and 2/3203/23 from the VEGA grant agency. References Szathmáry V, Ruttkay-Nedecký I.: Effects of different sources of ventricular repolarization heterogeneity on the resultant cardiac vectors. A model study. In: Gy. Surján, R. Engelbrecht, P. McNair (eds.) Health Data in the Information Society. Proceedings of MIE2002, IOS Press, Amsterdam, 2002, 88-92. Yan GX., Shimizu W, Antzelevich Ch. Characteristics and distribution of M cells in anterially perfused canine left ventricular wedge preparations. Circulation, 98, 1921-1927, 1998. Tyler M, Turzová M, vehlíková J. Repolarization Changes Displayed in Surface ARI Maps. A Simulation Study. International Journal of Bioelectromagnetism, 4(2), 99-100, 2002.
© International Society for Bioelectromagnetism
|