|
International Journal of Bioelectromagnetism Vol. 5, No. 1, pp. 238-239, 2003. |
www.ijbem.org |
|
A New Simple Algorithm for Heart Rate
Variability Analysis in Patients with Obstructive Sleep Apnea and Abdulnasir Hossena,
Bader Al-Ghunaimia, Mohammed O Hassanb aElectrical and Computer Engineering Department,
Sultan Qaboos University, Oman Correspondence: A Hossen, Electrical and Computer Engineering
Department, Sultan Qaboos University, Abstract. A new detection method
of obstructive sleep apnea (OSA) is investigated. This method is based on
the estimation of power spectral density (PSD) of the heart rate variability
(HRV) data. The novelty of the technique arises from the implementation of
a soft decision algorithm of sub-band decomposition of the RRI data. The result
of such algorithm is a staircase approximation of the PSD, from which the
ratio of energy in different frequency bands can be measured without implementing
any transform. The approximate estimated ratio of the PSD of the low-frequency
(LF) band to that of the very-low frequency (VLF) band is used in detection
of OSA and also in classification between OSA and normal controls.
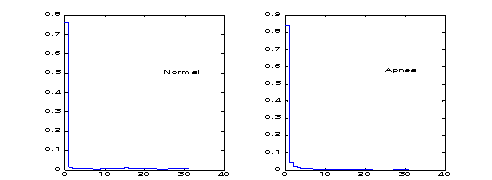
Keywords: ECG; HRV; Sleep Apnea; Sub-Band; Classification; Signal Processing and Analysis 1. Introduction Sleep apnea is the stop of breath during sleep that causes reduction in the level of oxygen in blood. HRV, which is defined as the variation of heart rate that accompanies the variation of several physiological activities, e.g., breathing, thermoregulation and blood pressure, has been proven to provide comparable results in sleep apnea analysis. Many signal processings techniques that study and classify sleep apnea, manipulate (HRV) data either in time-domain or in frequency-domain. 1.1. Time-Domain Algorithms Such algorithms manipulate the HRV data in time-domain to extract distinguishable statistical parameters such as the mean, the standard deviation and the variance [Aubert et al., 1998]. Other studies use the Hilbert transform to extract instantaneous parameters such as the instantaneous frequency and the instantaneous amplitude [Mietus et al., 2000]. The statistical parameters of those instantaneous values can be used in the classification. 1.2. Frequency-Domain Algorithms Frequency-domain analysis approaches use one of the known transformations such as FFT, STFT, wavelets to estimate the power spectral density of the HRV data. The frequency spectrum of the HRV signal is divided into three main bands [Aubert et al., 1998]:
Ratio of the power spectral density of the LF band to that of the HF band is used usually in the analysis of different physiological activities as well as in sleep apnea detection. 2. Material and Methods In this paper, the ratio of approximate power spectral density (estimated by sub-band decomposition) of the LF band to that of the VLF band is used in detection and classification of OSA. 2.1. Sub-band Decomposition FFT The idea of the sub-band decomposition FFT [Hossen et al., 1995; Shentov et al., 1995] is to decompose the input signal into low- and high-frequency bands, and then to process the two bands separately after down sampling. Approximation can be done if it is known that the energy is concentrated in one of the bands. So the FFT is computed only in this band resulting in an approximate transform with less computational complexity. If there is no information about the energy distribution of the signal, an adaptive method [Hossen and Heute, 1993] can be used to compare the energy of both bands to decide which band is to be computed and which band is to be ignored. 2.2. Soft-Decision Algorithm The sub-band decomposition is to be continued up to a certain pre-fixed depth, for example up to m stages to obtain 2m sub-bands. Instead of neglecting the lower energy band at each stage, a probability measure is assigned to each frequency band. At the following stage, the resulting estimate can be interpreted as the conditional probability of the new input sequence containing primarily low (high) frequency components, given that the previous branch was predominantly low (high)-pass. The assignment for the probability measure of the resulting sub-bands could be made equal to the product of the previous branch probability and the conditional probability estimated at a given stage. This process is terminated after the pre-determined depth m is obtained. 2.3. Power-spectral Density Estimation The probabilities derived from the estimation outputs may be interpreted themselves as a course measurement of the power spectral density. So after m-stage decomposition, a staircase approximation of the PSD is obtained, when the 2m probabilities are plotted. 2.4. Classification Factor Fig. 1 shows the PSD of both normal and OSA cases with 5 decomposition stages. 32 bands each are resulted with a bandwidth of (0.5/32) Hz. The second band approximates the PSD of the VLF band of the HRV data and the PSD of the LF band is approximated by the average of the 6th and the 7th bands. The ratio of the PSD of the LF band to that of the VLF band is used as classification factor R. Figure 1. PSD of both Normal and Apnea HRV data. 3. Results Pre-classified data of 20 patients having OSA and 10 normal controls drawn from MIT databases are tested. A threshold value for R of (0.26) is obtained for classifying OSA from normal HRV. A value of R greater than 0.26 corresponds to normal case, while a value of R less than 0.26 corresponds to OSA case. The proposed new algorithm gives 90% accurate classification with a sensitivity of 100% and with a specifity of 70%. 4. Discussion The simple soft decision algorithm used for estimating the PSD of the HRV data results in high classification efficiency. Such efficiency is obtained with sub-band decomposition and probability assignments with no need to apply any frequency transformation. The classification factor R is physically the ratio of PSD of the LF band to that of the VLF band. This result will pay attention of scientists to the VLF band, which is not usually considered in such classification. References Aubert A., Ramaekers D., Becjers F., Breem R., Ector H., Van de Werf F. Time and frequency analysis of heart rate variability pitfalls and misinterpretations. In: Monduzz: Editore. Bologna, Italy. 323-327, 1998. Hossen A., Heute U. Fully adaptive evaluation of subband DFT. Proceedings of ISCAS93, Chicago, USA. 655-658, 1993. Hossen A., Heute U., Shentov O, Mitra S. Subband DFT Part II: accuracy, complexity, and applications. Signal processing, 41 (3): 279-294, 1995. Mietus JE., Peng C., Ivanov PCH., Goldberger Al. Detection of obstructive sleep apnea from cardiac interbeat interval time series, Computers in cardiology, 27, pp.753-756, 2000. Shentov O, Mitra S., Heute U., Hossen A. Subband DFT Part I: definition, interpretation and extensions. Signal processing, 41 (3): 261-277, 1995.
© International Society for Bioelectromagnetism
|