 |
International Journal of Bioelectromagnetism Vol. 5, No. 1, pp. 234-235, 2003. |
www.ijbem.org |
|
Identification of Electrical Source Distribution Defects: Model-based Evidences Krisztina Szakolczaia and
György Kozmannab aResearch Institute for Technical Physics and
Materials Science, Budapest, Hungary Correspondence: Krisztina Szakolczai, György Kozmann,
Research Institute for Technical Physics and Materials Science, Abstract. Identification of differently
located and sized source distribution defects (old myocardial infarction,
MI) was assessed by numerical modeling. Results gained for QRST and 3rd
decile QRS integral maps are presented. Based on the evidences of the simulations,
from 8 up to 14 local source irregularities can be recovered in the left and
right ventricular mass.
Keywords: Numerical Heart Model; Body Surface Potential Map, 3rd QRS Decile and QRST Integral 1. Introduction The quantitative assessment of myocardial source distribution has a clinical importance (detection and quantification of myocardial infarctions, MIs, regions with shortened or lengthened action potentials, APs, etc.) Modeling provides excellent tools for such conceptual studies, as all the source parameters as well as the generated body surface signals are perfectly known (Selvester et al., 1987). In our study, the identification of completely unexcitable regions (myocardial infarctions, MIs) was studied. However, results obtained for QRST maps could be extended to the detection of repolarization inhomogenities. 2. Material and Methods The numerical model used consisted of a conceptual (simplified geometry) propagation heart model, and a realistic inhomogeneous torso model. [Szathmary et al. 1994, Tinova et al. 1996.] The source deficit due to a MI was characterized by the potential change relative to the normal, i.e. intact ventricular source distribution. By a systematical replacement of the unexcitable segments (see Fig. 1), we have associated the Dj(j) surface potential changes with the location and extension of the unexcitable tissue. In each location, the size of the unexcitable regions was increased step-by-step, from 10, up to 25 model units (MU) in radius (R), by increments of 5. All the other parameters like torso geometry and heart size and orientation was kept constant. The Dj(j) functions were computed for all the i=18 locations indicated in Fig.1. In the final step, decision areas, Wi , were defined as:
where: i and k indices of non-overlapping sub-regions assigned to one of the 18 MI locations j index of a surface unipolar lead. The above procedure was applied for QRST integral maps and for the QRS 3rd decile integrals. The first choice is optimal from the point of view activation propagation invariance, while the second one was proved to be optimal in a statistical study of patients with intact intraventricular conduction system (Geselowitz 1983, Kozmann et al. 1991) 3. Results Essentially the number of the observable source regions and the extension of the regions heavily depend on the location and dimension (characterized by the radius of the disk shape unexcitable tissue) of the MI. QRST integral maps are invariant to the simultaneous breakdown of the intraventricular conduction system, but the resolution in terms of the number of recognizable defects is suboptimal. The 3rd decile QRS maps (for R=25 MU) reveal the entire LV but only 3 RV locations while on QRST integral 7 LV and 7 RV locations distinguishable (Table 1.). The good result for LV sources is likely because in the 3rd decile interval the masking effect of the early right ventricular wall depolarization is rather limited. Usually the MIs positioned in the middle section are hardly observable. The maximal amplitudes of Dj(j) distributions grow linearly by increasing the radius of the infarction. If only one local source deficit is present, the location of the maximal negative departure from normal specifies dropout location, while the amplitude quantifies its extension.  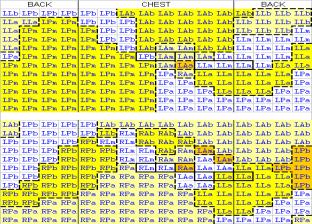 Figure 1. Left: Arrangement of simulated MI locations within the ventricles (similar for all the three levels).Right: Decision regions for radius 25MU (approx. 25 mm) for the 3rd decile QRS (upper) and for the QRST integral map (lower). Codes show the detectable locations in terms of the source representation shown in the left. V1-V6 positions are shown in heavy line boxes. One cell represents one lead of the 192 lead system. Table 1. Number of observable MIs vs. the radius of MI (in modeling units).
4. Conclusions The surface effect of approximately identically sized but differently located infarctions was tested by simulation. Generally, the middle-layer infarctions were not diagnosed reliably. In general, the bigger the infarction, the more number of observable unexcitable regions can be recovered. In our study, from 8 up to 14 of the 18 test locations were observable in the difference QRST integral and in the 3rd decile QRS integral maps. The results gained for the QRST integral maps are extendable to the detection of repolarization disparities as well. Acknowledgements This study was supported by the National Research Found grants T033085, T030747, F035268 and by NKFP grant 2/052/2001 of the Ministry of Education, Budapest, and by the bilateral cooperation of the Hungarian and Slovakian Academies. References Selvester, R.H.S., Solomon, J.C., Tolan, G.D.: A fine greed forward simulation of the total body surface electrocardiogram Its role in the development of quantiative diagnostic criteria. In: Proc. 9th EMBS Conference, Boston, 507-508, IEEE, 1987. Szathmary, V., Osvald R.: An interactive computer model of propagated activation with analytically defined geometry of ventricles. Comp. Biomed. Res., 27: 27-38, 1994. Tinova, M., Huiskamp, G.J., Turzova, M., Tysler, M. The uniform double layer model and myocardial infarction: forward solution. Brat. Lek. Listy 97, 558, 1996. Geselowitz, G.B.: The ventricular gradient revisited: Relation to the area under the action potential. IEEE Trans. BME-30:76-77, 1983. Kozmann, Gy., Lux, R.L., Green L.S.: Non-parametric identification of discriminative information in body surface maps. IEEE Trans. BME-38, 1061-1068, 1991.
© International Society for Bioelectromagnetism
|
|||||||||||||||||||||||||||||||||||||||||

