 |
International Journal of Bioelectromagnetism Vol. 5, No. 1, pp. 221-224, 2003. |
www.ijbem.org |
|
Non-Invasive Estimation of the Activation Sequence of the Heart in the Presence of Old Myocardial Infarctions: Comparison to Invasive Patient Data Thom Oostendorpa and
Jukka Nenonenb aDept. of Medical Physics, University of Nijmegen,
the Netherlands Correspondence: TF Oostendorp, Dept. of Medical Physics,
University of Nijmegen, P.O. Box 9101, NL-6500 HB Nijmegen, the Netherlands.
E-mail: Abstract. For 2 patients, who had
previously suffered myocardial infarctions, the activation sequence of the
heart was estimated from ECGs measured at the body surface by using the UDL-based
inverse. The results were compared to the activation times measured during
cardiac surgery. The results show that the correspondence between estimated
and measured activation times is good, provided that the site of the infarctions
is taken into account in the geometry of the source model used in the inverse
procedure.
Keywords: Inverse Problem; Activation Times; Myocardial Infarction; Invasive Measurements; UDL Model 1. Introduction In the Uniform Double Layer (UDL) source model during ventricular depolarization, the sources are described by the activation times at the ventricular surface [Cuppen et al., 1984]. The associated inverse procedure estimates the activation times at the ventricular surface from the ECGs measured at the body surface or the MCGs outside the body [Huiskamp et al., 1988]. Recently, the method has been adopted by other groups under the name of activation time imaging [Wach et al., 2001]. Over the last 15 years the performance of the UDL-based inverse has been evaluated by several studies by the Department of Physics of the University of Nijmegen, in collaboration with several other research institutes. Most of these studies yielded promising results. For normal subjects the activation sequences found corresponded well to those observed in isolated hearts [Huiskamp et al., 1988]. The site of earliest activation when pacing by a catheter was located correctly [Huiskamp et al., 1993]. In a study in which a dog heart was suspended inside a torso-shaped tank filled with saline, the activation times estimated from the ECGs recorded at the tanks surface corresponded well to those observed at the heart surface [Oostendorp et al., 1997]. However, in one study, in which the method was applied to clinical data, the results were not unanimously positive [Oostendorp et al., 2001]. In this study ECGs and MCGs were recorded in patients who were awaiting open chest ablation therapy. During cardiac surgery, electrograms were measured on the ventricular surface. For some patients, the correspondence between the activation sequence observed at the ventricular surface and the one estimated by the UDL-based inverse from the measured ECGs and MCGs, was poor. One possible reason for the poor performance of the UDL-based inverse for some of the patients lies in the fact that these patients had previously suffered extensive myocardial infarctions. The UDL model, in its basic form, assumes that every part of the ventricular myocardium becomes active at some time during the QRS complex. This obviously does not hold true for infarcted regions of the myocardium. In a recent model study we have shown that, if a part of the myocardium is incapacitated by infarction, and this is not accounted for in the source model, erroneous results may be produced by the inverse procedure, even for regions of the ventricular surface that are located far from the infarction [Oostendorp et al., 2002]. In the same study, a method that takes the infarction into account in the source model was introduced. It was shown that this greatly improves the performance of the inverse procedure. In the present study, this method is applied to the patients for whom the results of the UDL-based inverse in its original form were poor. The activation sequences found by the modified UDL-based inverse procedure are compared to those observed at the heart surface during surgery. 2. Material and Methods 2.1. Patient Data The patients included in this study ware selected from the patient group of a previous study, performed at the Helsinki University Central Hospital [Oostendorp et al., 2001]. This group consisted of patients who had previously suffered myocardial infarctions and were scheduled to undergo open chest surgery to treat ventricular tachycardia. Prior to surgery the ECG was recorded at 123 electrodes on the thorax. The ECGs were sampled at 1000 Hz with a resolution of 2.5 mV [Simelius et al., 1996]. Also MR images were recorded in order to construct individual volume conductor models of the thorax for each patient, including the torso (conductivity: 0.2 S/m), the lungs (0.04 S/m) and the blood-filled cavities within the heart (0.6 S/m). The surface of the ventricular myocardium was also constructed from the MR images. During surgery, the potentials at the epicardium were recorded at 102 bipolar leads in an electrode sock system (CardioLab®, Pruka Engineering Inc, Houston, TX, USA). The distance between the two electrodes of the bipolar leads was 4 mm. The location of the electrodes at the heart surface was reconstructed according to a sketch made during surgery. The activation times at the recording sites were determined from the electrograms recorded during sinus rhythm. 2.2. Inverse Procedure The current source during ventricular depolarization closely resembles a double layer, located at the activation wave front and with a uniform strength of 40 mV [van Oosterom, 1987]. As all double layers sharing the same rim generate exactly the same external fields, the actual double layer (wave front) cannot be determined uniquely from ECGs recorded at the body surface. In the UDL source model, an equivalent double layer (EDL) at the surface of the myocardium is used (see Fig. 1). For an equal anisotropy ratio of the conductivities of the intra- and extracellular medium this equivalence is exact [Geselowitz, 1992], otherwise it is an approximation based on the solid angle theory [Van Oosterom, 2002]. The equivalent double layer encompasses the part of the ventricular surface that has been reached by activation. Hence, during the depolarization phase, the extent of the equivalent double layer grows monotonously until it encompasses the complete ventricular surface.  Figure 1. Actual and equivalent double layers. Gray: depolarized mycardium. Bold line: double layer. The arrows indicate the direction of the double layer. From left to right: 1) Actual double layer at early ventricular activation; 2) Equivalent double layer at ventricular surface; 3) Actual double layer at a later stage;. 4) Equivalent double layer at that stage.
Let τ(x) be the activation time at position x at the ventricular surface Sv, and let A(y,x) be the potential at ECG electrode y generated by source activity at position x. In this study, A(y,x) was computed from the volume conductor model by using the boundary element method [Huiskamp et al., 1988]. In the EDL model, the potential Φ(y,t) at electrode y at time t is the total contribution of all parts of Sv that have been reached by activation:
where H(z) is the Heavyside step function (H(z)=0
for z<0; H(z)=1 for z≥ 0). The inverse
procedure involves finding the activation times τ(x) for
which the difference between the measured potentials Ψ(y,t)
and model potentials Φ(y,t) is minimal. This was done by
quasi-Newton optimization. The surface Laplacian of the activation times was used as a regularization operator
in order to handle the ill-posed nature of the inverse problem; see [Huiskamp
et al., 1988] for details. 2.3. Infarcted Hearts If a part of the myocardium is affected by an old infarction, the region involved is not depolarized. In such cases the correct surface on which to place the equivalent double layer is not the surface of the myocardium, but the surface of the tissue that participates in the depolarization, i.e. the myocardium with a hole at the site of the infarction (see Fig. 2).
 Figure 2. Equivalent double for a heart with an old myocardial infarction.
For 2 patients of the patient group from the earlier study discussed in section 2.1 documentation was available concerning the region of the heart affected by old infarctions. For the present study, geometry models for the infarcted hearts of these 2 patients were created by removing the infarcted regions from the geometry model of the myocardium generated from the MR images. These geometry models were used in the inverse procedure. The resulting activation sequences were compared to those observed at the ventricular surface during surgery, and to those obtained in the previous study (where the infarcted regions were not excluded from the heart geometry model). 3. Results Fig. 3 shows the measured activation sequence, the activation sequence found by the inverse procedure when the infarction was not taken into account, and the activation sequence found when the infarcted region was removed from the heart geometry model. For patient 1 the frontal view shows early activation at the center, and late activation at the top-left. The rear view shows late activation to the right of the infarcted region, and early activation at the top-left and bottom-right. Many of these features are not reproduced well in the results obtained when using the intact heart in the inverse procedure. On the other hand, the results obtained when including the infarction in the inverse procedure show a much better correspondence to the overall pattern of the measured activation times. In patient 2, the results obtained when the infarction is not taken into account are not as poor as in patient 1. However, there is still a marked improvement when the infarction is included. The early activation at the outflow region of the left ventricle (center of rear view) that is found when the infarction is not taken into account, is not seen in the measured data. The results obtained when the infarction is included show a more realistic late activation at this site, though not exactly at the position indicated by the measured data. Table 1 shows the RMS difference (computed at the locations of the epicardial electrodes) between the measured and estimated activation times for both methods. 4. Discussion As locations of the epicardial electrodes were reconstructed from a sketch done during surgery, the accuracy of these locations is limited. Hence, some disagreement between measured and estimated activation times does not necessarily reflect inaccuracy of the inverse procedure. More value should be attached to the overall pattern of the activation sequence.
In an earlier simulation study it was shown that the use of the UDL-based inverse procedure without taking old myocardial infarctions into account may lead to errors in the estimate activation times. The results of the present study clearly support this observation. Also, despite the limited size of this study (2 patients), the results obtained when the infarctions are taken into account are promising. Hence we conclude that the UDL-based inverse can estimate the activation sequence of the heart with reasonable accuracy, provided that old myocardial infarctions, if present, are implemented in the source model. We are currently engaged in a study to assess how accurate the site of the infarctions has to be known, and to investigate how well the UDL-bases inverse performs in a larger group of patients. 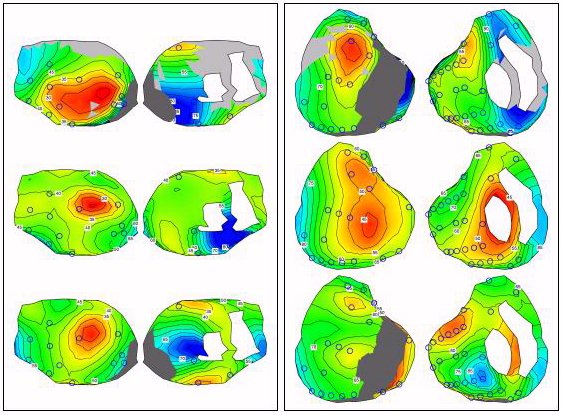 Figure 3. Left panel: results for patient 1, Right panel: results for patient 2. In each panel: - left column: frontal view, - right column: rear view, - top row: measured activation times, - middle row: estimated activation times when infarction is ignored, - bottom row: estimated activation times when infarction is taken into account. The circles indicate the positions of epicardial electrodes. Isochrones are drawn at 5 ms intervals. Red and blue indicate early activation and late activation, respectively. The infarcted region is drawn in dark grey. Acknowledgement The authors wish to thank the Division of Cardiology of the Helsinki University Central Hospital for providing the patient data used in this study. References Cuppen JM, van Oosterom A. Model studies with the inversely calculated isochrones of ventricular depolarization. IEEE --Transactions on Biomedical Engineering, 31, 652-659, 1984. Geselowitz DB, Description of cardiac sources in anisotropic cardiac muscle. Application of bidomain model. Journal of Electrocardiology, 25 Sup, 65-67, 1992. Huiskamp GJM, van Oosterom A. The depolarization sequence of the human heart surface computed from measured body surface potentials. IEEE Transactions on Biomedical Engineering, 35, 1047-1058, 1988. Huiskamp GJM, Oostendorp TF, Pijls NHJ, van Oosterom A. Invasive confirmation of the human ventricular activation sequence as computed from body surface potentials,. In Computers in Cardiology '92, 427-430, 1993. Oostendorp TF, MacLeod R, van Oosterom A. Non-invasive determination of the activation sequence of the heart: validation with invasive data. In Proceeding of the 19th Annual International Conference of the IEEE/EMBS, 335-338, 1997. Oostendorp TF, Pesola K. Non-invasive determination of the activation sequence of the heart based on combined ecg and mcg measurements. In the Proceeding of the 12th International Conference on Biomagnetism, 813-820, 2001. Oostendorp TF, Nenonen J, Korhonen P. Non-invasive determination of the activation sequence of the heart: application to patients with previous myocardial infarctions. Journal of Electrocardiology, 35S, 75-80, 2002. Simelius K, Tierala I, Jokinemi T, Nenonen J, Toivonen L, Katila T. A body surface potential mapping system in clinical use. Medical and Biological Engineering and Computing, 34-S1/2, 107-108, 1996. van Oosterom A. Computing the depolarization sequence at the ventricular surface from body surface potentials, in Pediatric and fundamental electrocardiography. Liebman J, Plonsey R, Rudy Y, editors. Martinus Nijhoff, 1987, 75-89. van Oosterom A, Solidifying the Solid Angle. Journal of Electrocardiology, 35S, 181-192, 2002. Wach P, Modre R, Tilg B, Fischer G, An iterative linearized optimization technique for non-linear ill-posed problems applied to cardiac activation time imaging. International Journal on Computations and Mathematics in Electrical and Electronic Engineering, 20, 676-688, 2001.
© International Society for Bioelectromagnetism
|
 phone +31 24 361
4240, fax +31 24 354 1435
phone +31 24 361
4240, fax +31 24 354 1435 Difference [ms](Infarction accounted for)
1 27.7 14.3
2 14.0 10.2](figs4/image141.gif)

