|
International Journal of Bioelectromagnetism Vol. 5, No. 1, pp. 193-196, 2003. |
www.ijbem.org |
|
Electrocardiographic and Acoustical
Data in Robert A. Warner, Patti Arand,
and Robert Myers Inovise Medical Inc., Newberg, Oregon, USA Abstract. In a controlled porcine
model, continuous electronic recordings of heart sounds and left diastolic
ventricular pressures showed that third and fourth heart sounds consistently
appeared with induced elevations of those pressures. Such elevations of diastolic
pressure are expected in many patients with left ventricular enlargement (LVE).
In 188 elderly ambulatory human subjects (62 men and 126 women, mean age =
70 years), simultaneous cardiac acoustical recordings and 12-lead ECGs were
compared. These recordings were obtained with a proprietary dual sensor that
acquires both acoustical and ECG data from a standard precordial electrode
position. The presence of third and fourth heart sounds was associated mainly
with relative prolongation of the PR interval and with flattening or negativity
of T waves in multiple leads. Conversely, these sounds were not associated
with the abnormalities of QRS voltage traditionally attributed to increased
left ventricular mass. We conclude that ECG and acoustical data can detect
abnormalities of ventricular function that the cardiac diseases responsible
for LVE characteristically produce.
Keywords: Ventricular Enlargement; ECG; Heart Sounds 1. Introduction Efforts to study the ECG manifestations of left ventricular enlargement (LVE) have largely involved comparing the ECG to estimates of left ventricular mass. In living subjects, these estimates have customarily been based on echocardiographic measurements of varying degrees of accuracy and involve combinations of both left ventricular volume and wall thickness. Since a change in either or both of these parameters contributes to the result, an elevated value of ventricular mass doesnt specify whether hypertrophy or dilatation predominates. However, increased left ventricular wall thickness often has very different etiologies and clinical implications than does increased chamber volume. Therefore, to blend these two parameters into a single derived value is not as informative as maintaining the ability to distinguish between the individual possible causes of increased left ventricular mass in a given patient. Depending on its etiology, the pathophysiology of LVE is associated with certain underlying hemodynamic abnormalities. The hypertrophy that results from chronic increases in afterload, e.g. from hypertension or aortic stenosis, tends to reduce ventricular compliance. In a patient in sinus rhythm, an abnormal decrease in ventricular compliance is often associated with a fourth heart sound (S4). In contrast, because of the LaPlace relationships among wall tension, ventricular volume, diastolic pressure and wall thickness, many dilated ventricles have abnormally high degrees of diastolic compliance. The rapid early diastolic filling associated with ventricular dilatation often produces a pathological third heart sound (S3). Therefore, the presence of an S4 or a pathological S3 in an appropriate clinical setting can help elucidate the predominant type of abnormal ventricular diastolic function that LVE has produced in a patient. Consequently, we hypothesized that by analyzing both ECG and acoustical findings, we can augment and refine our ability to detect abnormalities that are fundamentally associated with LVE. 2. Material and Methods Phase 1. In the first phase of the study, we used a controlled animal model to examine the relationship between intraventricular pressures and electronic recordings of the S3 and the S4. We studied 10 closed chest anesthetized pigs in sinus rhythm from whom we continuously recorded the following: heart sounds, a single lead ECG and left ventricular pressures using a catheter in the left ventricular apex. During these recordings in each pig, we recorded the above modalities as we produced transient elevations of left ventricular filling pressures by repeatedly inflating an angioplasty balloon in the left anterior descending coronary artery. Phase 2. In the second phase of the study, we obtained simultaneous acoustical data and 12-lead ECGs from 188 ambulatory subjects at a community activity center in northwestern Oregon. There were 62 men and 126 women and their ages ranged from 57 to 92 years with a mean of 70 years. We obtained these recordings using the Audicor system developed by Inovise Medical, Inc. that uses an inexpensive dual sensor that is placed is placed on the precordium in the V3 or the V4 electrode position. Part of the dual sensor acquires the standard ECG signal and the other part of the sensor acquires acoustical data from the same region, i.e. at or near the cardiac apex. Proprietary algorithms analyze and interpret both the ECG and the acoustical data and generate hardcopies of the 12-lead ECG and the recorded heart sounds on a single page. In addition to these analog recordings, the system stores, for all 12 ECG leads, the digital measurements of the following parameters: heart rate, PR, QRS, and QT intervals, P, Q, R, S and T wave amplitudes and durations and positive and negative displacements of the ST segments. For the purpose of the present study, we also calculated for each subject the Cornell (S in V3 plus R in aVL) and the Sokolow-Lyon (R in V5 and S in V1) voltages. We then used histograms to determine which of the above parameters have values with Gaussian vs. non-Gaussian distributions. For those with Gaussian distributions, we used the independent T test to determine if there were significant differences in the values between subjects with vs. those without S3s and S4s, respectively. For the parameters whose values were skewed, we used the non-parametric Mann-Whitney U test to determine the statistical significance of such differences.3. Results Phase 1. All 10 pigs had changes in the recorded acoustical data associated with the induced changes in left ventricular filling pressure. Five of the 10 pigs had neither an S3 nor an S4 at baseline and all developed either or both of these sounds after inflation of the balloon for at least sixty seconds. Four of the 10 pigs had low amplitude S3s at baseline and each of these pigs developed both more prominent S3 and a new S4. One of the 10 pigs had a soft S4 at baseline and developed a more prominent S4 after inflation. In each case, the appearance or intensification of the above sounds coincided with elevation of the left ventricular diastolic pressures. As anticipated, each S4 occurred at the same time as a prominent A wave in the ventricular pressure tracing during late diastole. Figure 1 illustrates these findings. As the left ventricular filling pressures fell toward their baseline levels after deflation of the angioplasty balloon, the previously recorded S3s and S4s either disappeared or became less prominent.
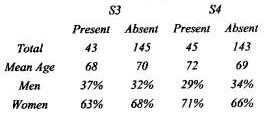
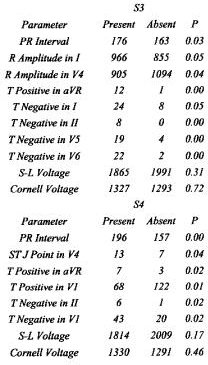
Figure 1. The left panel shows the left ventricular pressure and acoustical recordings at baseline. The right panel shows these tracings 1 minute after occlusion of the intracoronary balloon. After inflation, an S3 and an S4 are present, the latter coincident with an A wave intthe pressure tracing. Phase 2. Table 1 shows that the demographic characteristics of the subjects with and without S3s and S4s are similar. Table 2 lists the mean values of the parameters that exhibit statistically significant differences between the subjects with and without S3s and S4s. In this Table, the PR interval is in milliseconds and all other values are in microvolts. The data in Table 2 show that patients with either an S3 or an S4 have longer PR intervals than patients without these heart sounds. The difference in PR intervals is greater for the S4 than for the S3. The Table also shows that with the exception of small differences in the amplitudes of R waves in Leads I and V4, the remainder of the significant differences between patients with and without an S3 or an S4 are confined to abnormalities of repolarization, most frequently flattening or negativity of the T waves in several leads. In contrast, there are no significant differences in either the Sokolow-Lyon or the Cornell voltages between subjects with vs. subjects without either an S3 or an S4.
4. Discussion The results of Phase 1 of the present study confirm in a carefully controlled animal model that the presence of an S3 and an S4 is reliably associated with increased ventricular diastolic pressure. Although we produced these elevations of pressure acutely, the various diseases that result in LVE can cause similar elevations of diastolic pressure. In fact, it is such chronic elevations in pressure that serve as the fundamental pathophysiological stimuli for the hypertrophy and/or the dilatation that characterize LVE. Phase 1 of the present study also shows that electronic sensors applied to the surface of the body can reliably detect the S3s and the S4s that are associated with the abnormal increases in left ventricular diastolic pressure. Phase 2 of the study identifies the ECG findings in middle-aged and elderly humans that are associated with acoustical evidence of the types of left ventricular diastolic abnormalities that characterize LVE. We do not have echocardiographic or other data to permit us to estimate the left ventricular mass of these patients. However, we believe that because of the previous work that has demonstrated the adverse prognostic implications of the S3 and the S4, identifying the ECG abnormalities that are associated with these abnormal sounds may be at least as clinically relevant as determining the ECG findings that are related to high estimated values of ventricular mass.1-3 In support of this, our study shows that the ECG abnormalities that are most frequently associated with an S3 or an S4 are those that are related to ventricular repolarization. This is consistent with large epidemiological studies that have shown that patients with LVE who have abnormal ST segments and T waves have especially poor prognoses.4 Therefore, patients with known or suspected LVE who have these types of ECG abnormalities, especially in combination with pathological heart sounds, may be especially likely to benefit from aggressive surveillance and management of their underlying cardiac disease. Table 2 also shows that the subjects with abnormal heart sounds also have longer PR intervals than the subjects without these sounds. The reasons for this are uncertain, but it may be because a higher proportion of the patients with abnormal ventricles have intrinsic impairment of atrioventricular conduction or are receiving digitalis, beta-blockers or calcium channel blockers. In the case of the S4, it may also be because this sound is easier to detect when the PR interval is relatively prolonged. In patients with long PR intervals, the S4 is less likely to merge with the low frequency components of the first heart sound. In contrast to the abnormalities of ventricular repolarization and of atrioventricular conduction that are listed in Table 2, the traditional QRS criteria for LVE, including the sums of voltages that constitute the Sokolow-Lyon and the Cornell criteria, generally failed to demonstrate a significant association with acoustical evidence of abnormal ventricular function. In addition to trying to detect increased left ventricular mass with the ECG, one can augment the ECG with acoustical data to identify the functional abnormalities that are often associated with LVE and whose clinical significance has been clearly demonstrated. In this regard, the similarities of the ECG findings in the upper vs. the lower panel of Table 2 show that the ECG alone cannot reliably discriminate between patients with S3s vs. those with S4s. This illustrates why physicians have long recognized the value of cardiac auscultation in the evaluation of patients. Despite the availability of sophisticated modern diagnostic modalities, recent reports have confirmed the clinical utility of detecting the S3 and S4.5-10 Unfortunately, these sounds have both low acoustical frequency and amplitude and are therefore difficult to detect by auscultation. Consequently, physicians commonly fail to hear them during the physical examinations of their patients.11-13 However, an efficient and reliable electronic system for detecting and analyzing heart sounds can circumvent the limitations of the human ear. The present study demonstrates that it is possible to develop and effectively use such a system. 5. Conclusions Abnormalities of left ventricular compliance, such as those that are found in patients with LVE, often produce S3s and S4s. These abnormalities are associated with ECG findings that differ from those that traditionally have been attributed to increases in left ventricular mass. ECG and acoustical data can identify patients whose underlying cardiac disease has produced impaired ventricular function. References 1. Joshi N: The third heart sound. Southern Medical Journal 92(8):756-61, 1999 2. Maisel R: Survival after hospital discharge in matched populations with inferior or anterior myocardial infarction. Journal of the American College of Cardiology 6(4):731-6, 1985. 3. Glover DR.: Factors influencing survival and mode of death in severe chronic ischaemic cardiac failure. British Heart Journal 57(2):125-32, 1987. 4 Kannel WB, Dannenberg AL, Levy D. Population implications of electrocardiographic left ventricular hypertrophy. American Journal of Cardiology 60:851-931, 1987. 5. Bonow RO: Radionuclide angiographic evaluation of left ventricular diastolic function. Circulation 84(3 Suppl):I208-15, 1991. 6. Hiasa Y: Clinical manifestations, therapeutic methods and prognosis of patients with ischemic cardiomyopathy. Journal of Cardiography 13(2):309-16, 1983. 7. Perez, J: When does a fourth sound become an atrial gallop? Angiology (5):300-10, 1976. 8. Drazner MH; Rame JE; Stevenson LW; Dries DL: Prognostic importance of elevated jugular venous pressure and a third heart sound in patients with heart failure. New England Journal of Medicine 345(8):574-81, 2001. 10. Kono T.: Hemodynamic correlates of the third heart sound during the evolution of chronic heart failure. Journal of the American College of Cardiology 21(2):419-23, 1993. 11. Ishmail, B.: Interobserver agreement by auscultation in the presence of a third heart sound in patients with congestive heart failure. Chest 91(6):870-3, 1987. 12. Lok CE: The accuracy and interobserver agreement in detecting the gallop sounds by cardiac auscultation. Chest 114(5):1283-8, 1998. 13. Held P; Lindberg B; Swedberg K: Audibility of an artificial third heart sound in relation to its frequency, amplitude, delay from the second heart sound and the experience of the observer. American Journal of Cardiology 53(8):1169-72, 1984.
© International Society for Bioelectromagnetism
|
|||||||||||||||||