|
International Journal of Bioelectromagnetism Vol. 5, No. 1, pp. 167-170, 2003. |
www.ijbem.org |
|
Drug-Induced Changes of Ventricular
Repolarization: Jean-Philippe Couderc, Wojciech
Zareba, Arthur J. Moss HRFUP-Department of Cardiology, University of Rochester Medical Center, USA. Correspondence: JP Couderc, HRFUP Cardiology, University
of Rochester Medical Center, 601 Elmwood Ave., Box 653, Abstract. The validity of QT interval
measurements has become increasingly questioned since the FDA imposed pharmaceutical
companies to check whether their new compounds prolong the QT interval. In
our study, we investigated whether the quantification of T wave morphology
could help to better identify repolarization changes than QT prolongation.
Our observations led us to design an index of repolarization asymmetry (IRA).
This index quantified the time between the apex of the T wave and the point
in time where 25% of the total cumulated area of the overall T wave had been
reached. We detected statistically significant changes in the values of IRA
at low doses of sotalol plasma concentration. No QT prolongation was detected
at this concentration. The better identification of repolarization changes
were explained by a higher stability and a lower residual heart rate dependency
of IRA than QT interval (after Bazetts correction). These results may create
new incentives for the use of morphological repolarization measurements in
the assessment of drug safety as well as for the consideration of T wave morphology
for the risk stratification of patients prone to ventricular arrhythmias and
sudden cardiac death.
Keywords: Electrocardiography; Ventricular Repolarization; Sotalol 1. Introduction Currently, interest in the analysis of the morphology of the T wave is growing due to the difficulty in obtaining stable QT measurements (2,3,10) . The QT interval relies on the identification of the end of the T wave, which may be visually assessed differently according to the experience and training of the cardiologist/technician (6) . The use of a computer algorithm helps to detect more consistently the location of the end of the T wave (10) . However, computers may fail to identify this location correctly if the shape of the T wave is abnormal (low amplitude biphasic T wave) requiring visual checking of the automatic measurements (4) . The major common limitation to both manual and automatic measurements of the QT interval is their dependency on the final portion of the T wave neglecting the rest of the ventricular repolarization process, whereas the morphological analyses encompass the entire repolarization segment. They combine information about prolongation and shape changes of the repolarization signal. In this study, we investigated the occurrence of morphological changes of the repolarization segment in healthy subjects exposed to sotalol. We proposed a new index for the quantification of T wave asymmetry and compared this index changes to QT prolongations. 2. Methods The first day of the experiment was the baseline; during the second day patients were exposed to a single dose of sotalol (160 mg), during the third day a double dose of 320 mg of sotalol was used. Sixteen ECGs were recorded each day. Recordings were done at the same time each day for each patient. Sotalol blood plasma concentration was measured with each ECG. The protocol is described in detailed elsewhere (8) . ECGs were acquired after a five-minute resting period using the Mortara ELI 200 12-lead recorder and stored in digital format under proprietary XML format. QT intervals were manually measured (QT manual). Also, QT intervals were measured using our own developed software for Comprehensive Analysis of the repolarization Signal (COMPAS) that provides repolarization measurements on a beat-to-beat basis for all leads. These repolarization measurements are the QT interval (based on the maximum slope method: QT slope) and the area-based parameters. Area-based parameters are interval-duration measurements dependent on the morphology of the T wave. The time needed to reach 25% of the maximum value of the cumulated area under the T wave was computed. Figure 1 provides a description of the method used for locating the end of the T wave (panel A) and computing area-based parameters (panel B). For instance, the so-called QTa25% is the distance between Q and Ta 25% (see figure 1, panel B). The beginning of the QRS complex was identified in all 12-leads and the earliest one was used for the measure of the QT intervals in all leads. A heart rate (HR) corrected index of repolarization asymmetry (IRAc) was computed as the difference between QTc apex and QTac25% (see figure 1, panel A). The heart rate correction was computed based on Bazetts formula. This difference was dependent on the shape of the first half of the T wave. The smoother the ascending slope, the larger the IRA value. According to our observations the more symmetric the T wave was, the lower the value of IRA.
 Figure 1. Measurements of T wave duration and repolarization morphology. 3. Results Thirty-nine subjects were recorded. The averaged values of all parameters are given in Table 1 for baseline and for 3 ranges of sotalol plasma concentration (SPC). All parameters were significantly increased when the SPC was superior to 600 ng/ml. For a low SPC (between 0 and 300 ng/ml), HR and IRAc were the only parameters showing significant differences in comparison to baseline: 4 msec increased in average for the IRAc corresponding to a 6% change in comparison to baseline. At higher sotalol plasma concentrations, a 30% increase in IRAc was found (68±14 vs. 88±19 msec) whereas QT offset manual showed a 7% increase in its duration (374±19 vs. 399±25 msec). Table 1. QT repolarization measurements associated with three doses of sotalol plasma concentrations. Ψ p<0.03, *p<0.02 comparing mean values in reference to baseline measurements (SPC=0 ng/ml). QTc M is corrected QT manual. All parameters are expressed in msec but N that is the number of ECGs.
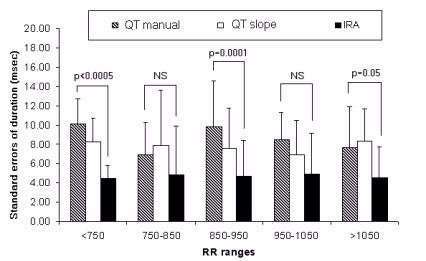
The stability of the measurements was investigated in order to check whether our new parameters provided results as stable as QT measurements. The results are given for various heart rate ranges in figure 2. The results revealed that the stability of IRA values was similar even higher than stability of QT measurements. The averaged standard deviation of intra-patient variation was close to 8 ms whereas this value was, in average, close to 4 ms for the IRA parameters. These differences were statistically significant in three RR ranges out of five as shown in Figure 2. The heart rate dependency of IRA was studied during baseline in lead V5 (based on 558 ECGs, see figure 3). The regression analysis showed that the IRAc/RR relationship was weak (R2<0.05% and p=0.6). Thus, there was independency between RR and the IRA parameters after applying Bazetts correction on QTa25 and QT apex measurements. Also, this figure confirms the inadequate correction of Bazetts formula for QT intervals (1,5,9) . Figure 2. Stability of repolarization measurements from
ECG recordings acquired during baseline. Figure 3. Linear regression analysis of QT slope, QTc slope, IRA and IRAc parameters in relationship to heart rate (RR). After applying the Bazetts correction, the QTc/RR relationship is still significant whereas there no significant relationship between IRAc and RR values. Without corrections, QT and IRA show significant positive relationship with RR. 4. Discussion Sotalol is known to prolong the QT interval by mainly increasing the action potential durations of the mid-myocardium cells (11) . The Ik blockade increases dispersion of transmural repolarization providing a substrate for intra mural reentry. This leads to a higher risk for ventricular arrhythmias such as torsades de pointes. The association between morphological changes of the T wave and the occurrence of arrhythmic events is less clear. The literature contains scattered studies that have used morphological quantifier of T wave morphology showing that this information may be associated or even used as a significant marker for the risk of ventricular arrhythmias. It was done in animal models and humans: in idiopathic LQTS patients (7) , in LQTS patients (2,13,13) . Also, morphology of T loop could improve the risk stratification of post myocardial patients for sudden cardiac death when combined with other parameters such as EF and HR (12) confirming again that repolarization morphology may be an important phenomenon. Our approach focused on the first half of the T wave where the sotalol had been found to have the more profound impact in our study. The analysis of the morphology of the T wave was shown to be relevant. Our results revealed that morphological changes occurred in the T wave even before QT prolongation was statistically identified (at SPC inferior to 300 ng/ml). The HR dependency of our morphological index was lower than the QT intervals; its stability was either equivalent or higher depending on the heart rate. These observations may create new incentives for using morphological features of repolarization rather than QT prolongation in the identification of drug safety in a near future. 5. Conclusions The study demonstrated that the morphology of the T wave could show significant changes prior to identifiable changes in the QT duration when a healthy subject is exposed to sotalol. Our investigation evidenced that the symmetry of the T wave was reduced when the sotalol plasma concentration was increased. The analysis of morphology may become an important parameter for the safety evaluation of new pharmaceutical compounds. Acknowledgements: The study has been done in collaboration with Pharmacia Clinical Pharmacology**, Chicago and eResearch Technology***, Philadephia. Our special thanks to Drs Nenad Sarapa and Joel Morganroth. References 1. Batchvarov, V. N.; Ghuran, A.; Smetana, P.; Hnatkova, K.; Harries, M.; Dilaveris, P.; Camm, A. J.; Malik, M. Am.J.Physiol Heart Circ.Physiol 2002, 282(6), H2356-H2363. 2. Couderc, J. P.; Zareba, W.; Moss, A. J. Automatic Analysis of the Repolarization Segment; Malmivuo, J., editor; Int Soc Biomagnetism: J. Int. Soc. Bioelectromagnetism, 2002; pp. 43-45. 3. Kautzner, J. Card Electrophysiol.Rev. 2002, 6(3), 273-277. 4. Malik, M.; Bradford, A. Pacing Clin.Electrophysiol. 1998, 21(8), 1656-1662. 5. Malik, M.; Farbom, P.; Batchvarov, V.; Hnatkova, K.; Camm, A. J. Heart 2002, 87(3), 220-228. 6. Murray, A.; McLaughlin, N. B.; Bourke, J. P.; Doig, J. C.; Furniss, S. S.; Campbell, R. W. Br.Heart J. 1994, 71(4), 386-390. 7. Padrini, R.; Butrous, G.; Statters, D.; Camm, A. J.; Malik, M. Int.J.Cardiol. 2001, 77(2-3), 151-162. 8. Sarapa, N.; Morganroth, J.; Moss, A. J.; Francom, S. F.; Darpo, B.; Fleishaker, C.; McEnroe, D. J.; Chen, W. T.; Zareba, W.; Couderc, J. P. Circulation 2003. 9. Sarma, J. S.; Sarma, R. J.; Bilitch, M.; Katz, D.; Song, S. L. Am.J.Cardiol. 1984, 54(1), 103-108. 10. Savelieva, I.; Yi, G.; Guo, X.; Hnatkova, K.; Malik, M. Am.J.Cardiol. 1998, 81(4), 471-477. 11. Yan, G. X.; Antzelevitch, C. Circulation 1998, 98(18), 1928-1936. 12. Zabel, M.; Acar, B.; Klingenheben, T.; Franz, M. R.; Hohnloser, S. H.; Malik, M. Circulation 2000, 102(11), 1252-1257. 13. Zareba, W.; Moss, A. J.; Konecki, J. J.Electrocardiol. 1998, 30 Suppl 191-195.
© International Society for Bioelectromagnetism
|