|
International Journal of Bioelectromagnetism Vol. 5, No. 1, pp. 143-144, 2003. |
www.ijbem.org |
|
Reconstruction and Clinical Measurement of Oleg Skipaa, Marc Nalbacha,
Ingo de Boera, Olaf Dössela, aInstitute of Biomedical Engineering, Universität
Karlsruhe (TH), Karlsruhe, Germany Correspondence: O Skipa, Institute of Biomedical Engineering,
Universität Karlsruhe (TH), Kaiserstraße 12, 76128 Karlsruhe, Germany. Abstract. Clinical measurements of
atrial excitation propagation were performed to validate the results of noninvasive
cardiac source reconstructions. Epicardial potentials and transmembrane voltages
were reconstructed using an individual volume conductor model of the patient.
Activation times were measured with a basket catheter and compared with the
time course of the reconstructed epicardial potentials and transmembrane voltages.
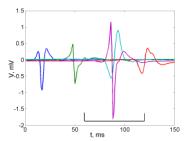
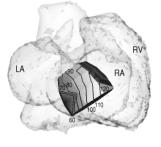
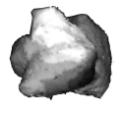
Keywords: Inverse Problem; Atrial Activation; Basket Catheter 1. Introduction The inverse problem of the electrocardiography deals with the reconstruction of the electrical activity of the heart from the measurement of body surface potential maps (BSPM). This non-invasive technique can be a valuable diagnostic tool for cardiologists. Numerous mathematical methods were developed to approach the problem. The first step to access the applicability of such methods is done by computer simulations. The next, more complex validation stage is the comparison with clinical invasive measurements or with measurements on phantoms. In this work, we present the results of the measurements of atrial excitation, followed by the solution of inverse problem of electrocardiography in terms of epicardial potentials and transmembrane voltages. The individual volume conductor model was constructed by segmentation of MRI scans of the patient. The electrodes on the body surface and the measurement catheter were localized from stereo video and X-ray images. 2. Material and Methods The problem of the reconstruction of the epicardial potentials or transmembrane voltages from BSPMs is linear and can be written as
where A is the lead-field matrix describing the imaging properties of the volume conductor, x is the source vector to be found (epicardial potentials or transmembrane voltages) and y is the measured BSPM. The matrix A is computed from a sequence of forward computations. The procedure for transmembrane voltage reconstruction is described in more detail in [Skipa et al., 2002]. To solve the inverse problem, the improved Tikhonov 0-order regularization [Greensite, 1998] was applied. The experimental measurements were done in collaboration with St. Vincentius Hospital in Karlsruhe. The patient is 74 years old and has the weight of 76 kg. The diagnose of this patient was atrial flutter. The measurements of atrial excitation were performed as part of an RF-ablation procedure. The multielectrode basket catheter Constellation (Boston Scientific, Massachusetts, USA) was used to get 32-channel bipolar electrograms. The catheter was placed in the right atrium. The activation times at the site of every electrode pair were determined as the times of maximal deflection in the electrograms. The position of the catheter with respect to the surface measurement electrodes was determined from a pair of X-ray images made at different angles [de Boer, 2001]. The BSPMs were recorded with a 32-channel SynAmps amplifier (Neuroscan, El Paso, Texas, USA). The electrodes were localized from stereo video images taken before the measurements [de Boer, 2001]. 3. Results The recorded bipolar electrograms of atrial activation and the resulting activation times are shown in Fig. 1. The isochrones are shown on the surface in place of the basket catheter. The epicardial potentials and transmembrane voltages were reconstructed for the whole period of atrial activation. Several time instants corresponding to the activation times from Fig. 1 are shown in Figs. 2 and 3. Figure 1. 5 bipolar electrograms (left) and the activation times (right) for one cycle of atrial activation. Figure 2. Reconstructed epicardial potentials during atrial activation. Dark areas correspond to lower potential, light areas corrspond to higher potential. Figure 3. Reconstructed transmembrane voltages for atrial activation. Light areas correspond to depolarized tissue, dark areas corrspond to repolarized tissue. 4. Discussion The time course of the reconstructed epicardial potentials and transmembrane voltages shows approximate correspondence with the measured activation times. The work presents the experimental procedure to validate the results of cardiac source imaging. The future work will include further improvement of measurement and signal processing techniques. References de Boer I. Methoden zur Bestimmung von dreidimensionalen intrakardialen und extrakorporalen Elektrodenpositionen. PhD thesis. Universität Karlsruhe (TH), 2001. Greensite F. Second order approximation of the pseudoinverse for operator deconvolutions and families of ill-posed problems. SIAM Journal on Applied Mathematics, 59(1): 1-16, 1998. Skipa O, Nalbach M, Sachse F, Werner C, Dössel O. Transmembrane potential reconstruction in anisotropic heart model. In proceedings of the 29th International Congress on Electrocardiology and 4th International Conference on Bioelectromagnetism. International Journal of Bioelectromagnetism, 4(2): 17-18, 2002.
© International Society for Bioelectromagnetism
|