Segmentation of
MR Images using Deformable Models: Application to Cardiac
Images
Correspondence: J Lötjönen,
Human Interaction Technologies, VTT Information Technology,
P.O. Box 1206, FIN-33101 Tampere, Finland. E-mail: jyrki.lotjonen@vtt.fi,
phone +358 3 316 3378, fax +358 3 317 4102
1. Introduction
Segmentation is often a pre-requisite for many applications
utilizing medical images, such as for making dose planning
in radiotherapy, and for visualizing three-dimensional (3D)
data in surgical planning. Since modern medical imaging
systems can generate even hundreds of slice images from
an object of interest, the extraction of shape knowledge
by manual segmentation is a long and tedious process. Therefore,
a great number of different approaches, such as region growing,
fuzzy clustering and neural networks, has been proposed
to automate the segmentation process [Acharya and Menon,
1998]. However, a generally applicable, fast, fully automated
and robust method for segmenting human organs is still not
available. The segmentation of medical images can be particularly
challenging even for a specialist because the images contain
typically complex noisy structures and may also lack some
anatomical borders. The use of a priori knowledge
is, therefore, often essential. In the techniques referred
to as deformable models, a priori knowledge is incorporated
by making assumptions on the final segmentation result;
the result can be constrained to be, for example, a smooth
continuous surface. The methods based on deformable models
are widely used in medical image segmentation and motion
tracking [McInerney and Terzopoulos, 1996]. The optimal
method for a given problem depends highly on the characteristics
of the application; the models themselves as well as the
techniques to deform them vary appreciably.
This paper concentrates on cardiovascular segmentation
and motion tracking using magnetic resonance (MR) images.
However, the methods discussed are generally applicable
for many other application areas and imaging modalities.
In the next section, a short survey is presented on deformable
models, emphasizing the aspects related to cardiovascular
images. Thereafter, one recently proposed technique [Lötjönen
et al., 2001] is discussed in detail and applied in two
case studies: 1) the segmentation of a short-axis cardiac
MR volume and 2) the motion tracking of the heart using
a short-axis cine MR volume. Finally, the discussion is
presented.
2. Related Work
2.1. Models Preserving the Topology without a Priori Shape
Knowledge
The most well known deformable model is a physics-based
active contour model, also referred to as a snake [Kass
et al., 1987]. The position of the snake is described by
a parametric function: v(s)=(x(s),y(s)),
sÎ [0,1]. It is deformed by minimizing
energy consisting of physics-based internal and external
constraint forces, and forces derived from the image to
be segmented:
| |
 |
(1) |
where the first integral depicts the internal energy of
the snake due to stretching and bending respectively. The
functions w1(s) and w2(s)
give a balance between the physical properties of the model
as well as between the physical properties and the other
forces. The scalar field P(v) represent image forces,
which are usually defined from image features, such as the
local image intensity or gradient. The external constraints
are included in the last integral, e.g. a user specified
repulsion force at a fixed position. The energy minimum
is found numerically by solving the Euler-Lagrange equation.
If the initialization of the snake is far from the desired
result, the model may deform to an incorrect local minimum;
initialization is a well-known problem related to deformable
models. In the original article, the robustness was improved
by using the scale-base approach, where the image
is low-pass filtered before computing the image forces represented
by gradients. Low-pass filtering leads to noise reduction
and increases the attraction range to salient edges. In
the widely adopted multi-resolution approach [Bajcsy
and Kovacic, 1989], the images were low-pass filtered and
subsampled sequentially. The modeling is done first for
the lowest resolution data and the result is used as an
initialization for the next higher resolution data. In addition
to the advantages from the scale-base approach, the computational
complexity of the deformation is then reduced. The attraction
field can be extended even more by a distance transformation
computed for binarized images [Borgefors, 1986], but the
problem is often to find a good binarization. More degrees
of freedom, often at higher frequencies, are gradually added
to the deformation in the global-to-local approach,
i.e. a global alignment is defined before local matching.
In addition to these standard techniques, many other improvements
have been reported, such as using a balloon force inflating
or deflating the model across local minima [Cohen, 1991],
and applying dynamic programming to find the global energy
minimum [Geiger et al., 1995].
Conventional snake-based methods appear to be well suited
to shape reconstruction, but they do not fit well to object
recognition. The aim of the object recognition is to describe
the deformations with relatively few parameters. Therefore,
methods such as standard engineering technique finite
element methods (FEM) technique have been used to parameterize
the deformations. A parameterization can be obtained from
the eigenvectors of the FEM model corresponding to the object
[Pentland and Horowitz, 1991]. Another method is to combine
global and local representations. Superquadrics can be used
to describe the global shape of the object, whereas the
object is locally deformed using the FEM basis functions
[Gupta et al., 1994]. Alike method, without using the physics-based
approach and the FEM, combines superquadrics and free-form
deformations (FFD) [Bardinet et al., 1998]. In the FFD,
a model is positioned inside of a regular grid and the model
is deformed according to the grid point displacements using
linear or spline interpolation.
Highly convoluted objects, such as the human cortical surface,
are frequently segmented from MR images using hybrid methods
by applying sequentially several image processing operations
[Dale et al., 1999; Xu et al., 1999]. The initial surface
or a pre-segmentation is usually extracted by using different
image processing techniques, such as local intensity-based
segmentation methods and morphological operations. The final
surface is generated using deformable models.
2.2. Models Preserving the Topology with a Priori Shape
Knowledge
A priori shape knowledge, depicted often by a template,
represents the typical shape of the object to be reconstructed.
If a shape template is provided, the initialization problem
of the conventional snake-based methods is, at least partly,
overcome and the segmentation process becomes more robust.
In probabilistic deformable models, the shape of the object
was represented by a weighted sum of orthogonal functions,
such as Fourier basis-functions, where the probability distributions
for the weights, i.e. the parameters, were known [Staib
and Duncan, 1996]. The distributions were determined from
a training set. The mean of the distributions defined the
initial model, and the deformation followed the deviation
of the distribution around the mean. An objective function
to be maximized during the deformation was the sum of two
terms indicating the probability of the parameters and the
degree of correspondence between the model and the image.
In probabilistic models, the ability to represent different
topologies is limited and a high number of harmonics are
needed to model highly convoluted objects.
The Active shape model (ASM), proposed by [Cootes et al.,
1995], defines the mean model and its deformation modes
consistent with a training set by statistical computations.
The model consists of a point set. The mean model is computed
by defining the point-to-point correspondence between the
different models in the training set, and by calculating
an average for the points. A covariance matrix is computed
for the displacements from the mean model. The eigenvectors
of the covariance matrix define the deformation modes of
the mean model. The deformation is accomplished iteratively
by defining the magnitudes for the deformation modes, which
move the model toward the strongest image edges. Instead
of using the ASM, the model can be represented by Fourier
basis-functions and the deformation modes of the training
set can be defined by performing the principal component
analysis to the Fourier coefficients [Székely et al., 1996].
A major problem of statistical models is that the building
of a representative training set can be laborious, if the
point-to-point correspondence definition cannot be automated.
Active appearance model (AAM) extends ASM by modeling also
the gray-scale variability [Cootes, 1999]. In the final
matching result, both the shape and the appearance of the
model should match the destination data. In [Mitchell et
al., 2001], the ASM and AAM were combined into a hybrid
model.
Boundary template models, represented by a contour(s) in
2D or a surface(s) in 3D, are similar to statistical shape
models, except that the model is not necessary a mean in
statistical sense, and it is not deformed using statistically
defined modes. The boundary templates can be deformed using
methods similar to the snakes considering, for example,
material stiffness and bending; the difference is that the
initialization is pre-defined. The template used in [Lelieveldt
et al., 1999] was a geometric and topologic model representing
thorax, lungs, epicardium, ventricles and liver. The organs
were modeled using multiple hyperquadric surfaces. The model
was matched to the boundaries in the image by varying the
scale and the pose of the hyperquadrics. A set of triangulated
surfaces was matched to noisy binarized edges using FFD
in [Lötjönen et al., 1999]. The change in the model’s
shape was regulated during the deformation. In addition,
the multi-resolution and the global-to-local approaches
were used.
A volumetric template is an extension of the boundary templates.
The volumetric template is a volume data set, where each
voxel contains a vector consisting of real and symbolic
information, such as an anatomic label and gray-scale information
from an MR volume. If tissue classes are included in the
template, it is referred to as an atlas. Volumetric templates
can be constructed by segmenting, possibly manually, the
organs of interest from a representative data volume. The
volumetric templates are matched with the patient data by
maximizing a correlation measure. In [Christensen et al.,
1996], physical properties of either elastic solids or fluids
were simulated in the deformation. The difference between
the gray values of the model and data were minimized while
keeping simultaneously the transformation smooth. The transformation
was also constrained to be smooth in [Rueckert et al., 1999]
but mutual information (MI) was used as a similarity measure.
The model was deformed using FFD.
2.3. Models Allowing Changes in the Topology
In general, the major problem in the snake-based methods
is that the model should be initialized reasonably close
to the desired shape. Moreover, the snake-based methods
do not easily recover shapes containing high frequency components,
such as protrusions. A level-set approach was designed to
overcome these problems [Malladi et al., 1995]. The method
is based on the idea of propagating wave fronts with curvature-dependent
speeds. The method is relatively independent on the initialization
and can produce protrusions, such as in a human vessel trees,
and changes in topology of the model. Alternatively, a method
based on a dynamic triangulated model using Newtonian dynamics,
and adapting its topology and geometry according to input
data can be applied [Lachaud et al., 1999]. The deformation
is controlled by internal constraints, such as the surface
curvature and the distance between the nodes in the triangulation,
and external constraints, such as forces defined by the
intensities of the input data. In [McInerney and Terzopoulos,
1999], the formulation of the snakes was extended producing
T-snakes. T-snake is a normal snake, which is projected
on a regular grid and thereafter reparameterized during
each iteration step. Reparameterization allows changes in
the topology.
2.4. Aspects Related to Cardiovascular Segmentation
Segmentation of heart. Several of the reviewed papers,
such as [Bardinet et al., 1998; Cohen, 1991; Geiger et al.,
1995; Gupta et al., 1994; Lelieveldt et al., 1999; Lötjönen
et al., 1999; Mitchell et al., 2001; Staib and Duncan, 1996],
were applied to the segmentation of the heart, i.e. the
left ventricle (LV), the right ventricle (RV) and/or the
epicardium The segmentation of the epicardium is problematic.
In some regions, there are no visible edges between the
myocardium and surrounding tissues. For this reason, deformable
models, especially template-based methods, are needed to
estimate the lacking edges. The other problem is that some
people have, in practice, no fat around epicardium while
some people may have several millimeters. If the fat is
present, the model attaches easily to the strongest edge
between the lungs and the epicardium. The techniques modeling
appearance can cope the problem. The segmentation of the
ventricles is more straightforward, but still the noise
and imaging artifacts may cause problems. In addition, doctors
use to segment the ventricles by drawing a convex hull surrounding
blood masses. The most of the deformable models attach,
however, to the strongest edges and follow the papillary
muscles inside the convex hull. The problem can be solved
by volumetric transformations as the desired hull is transformed
after the segmentation using the defined transformation.
Segmentation of vessels. The segmentation of the
vessel trees was demonstrated in [Malladi et al., 1996;
McInerney and Terzopoulos, 2001]. The template-based methods
cannot solve the problem, because of high variability between
humans. In addition, conventional snakes cannot recover
protrusion very well, but interactive software packages
utilizing snakes exist [Liang, 2001].
Motion tracking. In MR imaging, the dynamic behavior
of the organs can be modeled using cine sequences, i.e.
several images are acquired from the same location at different
time instants. Motion tracking of the heart was demonstrated
in [Pentland and Horowitz, 1991; Nastar and Ayache, 1996].
The methods based on volumetric templates produce motion
vectors for the whole image area without segmentation. However,
motion tracking of a specific organ and its quantification
is usually required. In that case, data from one time instant
need to be segmented, and it is used as a model for the
motion tracking. If segmentation is available for all time
instants, methods utilizing surface metrics can be used,
e.g. matching surface areas with similar curvatures [Kambhamettu
and Goldgof, 1994]. Parametric models or deformations are
the most feasible, if the quantification of the motion is
desired. The strength of the parametric methods is that
the motion is characterized using a small set of parameters.
Finally, it is worth noting that the deformation to the
closest edge point, as often used in deformable models,
does not necessarily represent the real motion of an organ.
For example, the twisting of the heart is difficult to model
with conventional methods. The MR technique referred to
as tagging is used to model the exact motion.
3. Material and Methods
Next, one method [Lötjönen and Mäkelä, 2001] is presented
in detail.
3.1. Matching Using a Volumic Template
The model used is a volumetric template consisting of two
components: a gray-scale volume and triangulated surfaces
of the objects of interest. In this study, the volume of
the size 128x128x125 is a T1 weighted short-axis MR volume
of the heart (Fig. 1). The surfaces included in the model
are the epicardium, the LV and the RV.
Figure 1. Volumetric
template: a set of slices from the gray-scale volume and
the triangulated surfaces superimposed on the images.
The model needs to be rigidly registered, i.e. translated
and rotated, to a destination data volume before elastic
matching. In practice, the translation errors of a few voxels
and the rotation errors of several degrees are acceptable.
Automated methods exist but manual coarse registration can
be done in a couple of minutes.
In the following, the model volume is referred to as a
volume M, and the destination volume to which the
model is matched, volume D. Consequently, a voxel
from the volumes M and D are m=(m1,m2,m3)
and d=(d1,d2,d3),
respectively.
The elastic transformation function is determined by maximizing
a similarity function between the model and data. The similarity
function consists of three components: MI, joint gradient
information and shape regularization.
Mutual information. MI measures the degree of dependence
between the volumes M and D. MI is high if
the gray-scale value of a voxel in D can be estimated
with a high accuracy by knowing the gray-scale value of
the corresponding voxel in M. The similarity criterion
based on MI allows matching also images from different imaging
modalities. As the gray-scale values of the volumes M
and D are considered random variables A and
B, respectively, MI is computed from the equation
[Maes et al., 1998] :
| |
 |
(2) |
where pA(a) and pB(b)are
marginal probabilities and pAB(a,b) is
the joint probability distribution. pA(a)
is a probability that the gray-scale value of a voxel
in M is a. pAB(a,b) is a
probability that the gray-scale values of corresponding
voxels in M and D are a and b,
respectively.
Joint gradient information. The edges in M
should match similarly oriented edges in D. The similarity
criterion derived from the image gradients is computed as
follows [Pluim et al., 2000]:
| |
 |
(3) |
where N is the number of model points overlapping
the volume D. The intensity ranges of the volumes
M and D should be set nearly similar before
the matching. If inter-modality matching is used, the equation
is modified by taking an absolute value from the dot-product.
Shape regularization. The change in the shape of
the model surfaces is constrained during the matching. In
this study, the change of the model’s surface normals
is controlled. The shape similarity of the original model
and the deformed model is computed as follows:
| |
 |
(4) |
where Ntr is the total number of triangles
in the model surfaces, ni and nio
are the deformed and the original orientations of the surface
normals of the triangles, respectively.
Combined similarity criterion. The model is deformed
by maximizing the following total similarity criterion:
| |
 |
(5) |
where a and b are user-specified weight parameters for
different similarity components.
The transformation is applied to all model points, i.e.
the voxels and surface points, which are inside the region
defined by a deformation sphere. The sphere is positioned
into a high number of locations (>10000) and the transformation
is applied sequentially in each position. The center of
the sphere is randomly positioned on the surfaces of the
model.
Fig. 2 demonstrates the functionality of the deformation
sphere, which is shown by the big circle containing arrows.
The dark and light gray areas on the left represents a part
of the myocardium and the left ventricle, respectively.
The arrows (vectors) in Fig. 2 describe the displacements
for the model points in the corresponding positions. A displacement
vectors are derived from the vector posed to the center
of the sphere (bold arrow in the center). The vector in
the center is weighted by a Gaussian kernel in such a way
that the weight is one in the center and zero on the sphere
surface and outside of it. The purpose of the deformation
algorithm is to find an optimal displacement by determining
a vector for the center. In practice, several different
vectors are tested (usually 6-12 vectors in 3D), the corresponding
displacement fields are applied to the model, and the one
producing the highest similarity value (Eq. 5) is chosen.
The orientation of each tested vector is randomly chosen.
The small circle with light center and dark borders visualizes
the probability distribution for different vector orientations
and lengths: the lighter is the gray-value the higher is
the probability. The probability distribution is a Gaussian
function preferring small displacements. The displacements
outside the small circle are prohibited.
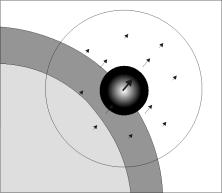
Figure 2. Displacement vectors inside
a deformation sphere.
The global-to-local approach is used in the method. This
is accomplished by decreasing gradually the size of the
deformation sphere during iterations. The user specifies
the maximum and the minimum radius for the sphere. The size
is reduced as the value of the similarity function does
not decrease more than e during an iteration. The number
of spheres applied for one iteration is relative to the
volume of the model divided by the volume of the sphere.
The multi-resolution approach is also adopted, i.e. a low
resolution model volume is produced by Gaussian filtering
and subsampling a high resolution volume. The deformation
is first done for the lowest resolution volume. As the maximum
similarity value is attained, the transformation defined
is applied as an initialization for the higher resolution
level.
3.2. Image Data
Segmentation. The destination data used was
a T1-weighted short-axis MR data volume from the heart (Siemens
Magnetom Vision 1.5 T system at the Department of Radiology
in Helsinki University Central Hospital, Finland). The original
volume consisted of 18 slices of 256x256 pixels. The pixel
size was 1.36 mm x 1.36 mm and the slice thickness 10.0.
However, the data volume was interpolated to isotropic and
only the area containing the heart was extracted from the
original volume for the segmentation. The final volume segmented
was the size of 128x128x125 voxels.
Motion tracking. The data used in motion
tracking were similar to the data used in segmentation except
the data contained 10 volumes from various time instances
during the cardiac cycle. The time difference between the
volumes was 40 ms.
4. Results
4.1. Segmentation of the Heart
Fig. 3 shows a set of slices from the destination data
and the model superimposed on the data before (the top row)
and after (the bottom row) the deformation. The overall
result is good. However, we have also developed an interactive
3D software package by which the possible segmentation errors
can be corrected in a few seconds.
Four resolution levels were used in matching. The user-defined
parameters in Eq. 5 were a=2 and b=15. The size of the deformation
sphere varied from 15 to 5 at each resolution level. The
computation time using a standard PC (600 MHz Pentium) was
a few minutes.
Figure 3. Segmentation
of the epicardium, LV and RV. Upper row: The model surfaces
superimposed on the destination data before (the top row)
and after (the bottom row) matching.
4.2. Motion Tracking of the Heart
The four rows of Fig. 4. show a set of slices from end-diastolic
phase to systolic phase. Each image visualizes gray-scale
values from two volumes using the chessboard visualization
technique. The first row shows the original volume (t=2)
with the result as the volume (t=1) is matched to the volume
(t=2). The second, third and fourth rows visualize the original
volumes (t=3, t=4 and t=5), respectively, with the deformed
data as the result from the previous time instant (t=2,
t=3 and t=4) is used as an initial model. In other words,
the volume (t=1) is sequentially matched to the time instants
from t=2 to t=5. The continuous edges of Fig. 4 show that
the matching was able recover the motion reasonably well.
Since the appearance is not modeled, the gray-scale differences
between the volumes remain in the result, and the chessboard
effect is visible.
Two resolution levels were used and the parameters in Eq.
5 were a=2 and b=10. The size of the deformation sphere
varied from 15 to 6 at each resolution level.
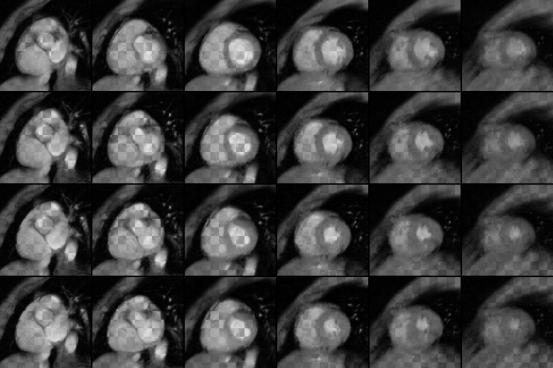
Figure 4. The rows
from the top down visualize the volumes from time instants
(t = 2, t = 3, t = 4 and t = 5). Chess-board visualization technique
is used to show in each image gray-scale values from the
original and deformed volumes, i.e.the areas shown from
the deformed model and from the original data vary as the
black and white areas in the chessboard. The volume (t = 1)
is used as a model.
5. Discussion
Deformable models are widely used in medical image segmentation.
In general, deformable models are superior to the techniques
utilizing local intensity criteria, if edges in the data
to be segmented are unclear, e.g. noisy or incomplete. For
example, the automatic segmentation of epicardium from MR
images is extremely difficult without a priori knowledge,
because images contain no clear edges in some regions between
epicardium and surrounding tissues. Since deformable model
techniques differ appreciably with each other, the feasibility
of a specific technique for a given segmentation problem
needs to be carefully considered.
A major problem of deformable models is to find an initial
model, which is not too far from the desired edges. Even
though the model was well-initialized, complex human structures,
noise, imaging artifacts and imaging features, e.g. the
ability to separate myocardium from surrounding tissues,
can make the segmentation task difficult. In practice, a
user-interaction is still needed in many cases.
The method, which was demonstrated in this work, estimated
relatively well the epicardium as well as the LV and the
RV. However, if the destination data contains fat around
epicardium and the model not, the method fails to segment
correctly the epicardium. Further development is needed
to include the AAM like features to the method. The result
of motion tracking appeared also visually good. The real
motion of separate model points was not, however, known
and the transformation defined could not be therefore validated.
The tagging technique should be used to validate the result.
This work concentrated on MR images but cardiovascular
hemodynamics could be studied using also other imaging modalities,
such as X-ray imaging, computerized tomography, ultrasound
imaging single photon emission tomography (SPET) and positron
emission tomography (PET). The deformable model techniques
described could be applied as well to these modalities but
the segmentation of functional SPET and PET images is still
a difficult problem even with deformable models.
Acknowledgements
The authors express thanks to The Department of Radiology,
Helsinki University Central Hospital, Finland for providing
volume images. Research work was supported by the National
Technology Agency, Finland.
Acharya R, Menon RP. Review of biomedical image segmentation
techniques, in Deformable models in medical image analysis.
IEEE Computer Society Press, 140-161, 1998
Bajcsy R, Kovacic S. Multiresolution elastic matching.
Comp. Vis., Graph.. and Image Proc., 46: 1-21, 1989.
Bardinet E, Cohen LD, Ayache N. A parametric deformable
model to fit unstructured 3d data. CVGIP: Comp. Vis.
and Image Understanding, 71(1): 39-54, 1998.
Borgefors G. Distance transformation in digital images.
Comp. Vis, Graph. and Image Proc., 48: 344-371, 1986.
Christensen GE, Miller MI, Vannier MW, Grenander U. Individualizing
neuroanatomical atlases using a massively parallel computer.
IEEE Computer, January, 1996.
Cohen LD. On active contour models and balloons. CVGIP:
Image Understanding, 53(2): 211-218, 1991.
Cootes TF, Taylor CJ, Cooper DH, Graham J. Active shape
models – their training and application. Comp. Vis.
and Image Understanding, 61(1): 38-59, 1995.
Cootes TF. Statistical models of appearance for computer
vision. http://www.isbe.man.ac.uk/~bim/Models/app_model.ps.gz,
1999.
Dale AM, Fischl B, Sereno MI. Cortical surface-based analysis
I. Segmentation and surface reconstruction. NeuroImage,
9: 179-194, 1999.
Geiger D, Gupta A, Costa LA, Vlontzos J. Dynamic programming
for detecting, tracking and matching deformable contours.
IEEE Trans. Pattern Anal. Machine Intell., 17(3):
294-302, 1995.
Gupta A, O’Donnell T, Singh A. Segmentation and tracking
of cine cardiac mr and ct images using a 3-D deformable
model. In proceedings IEEE Conf. Computers in Cardiology,
1994, 661-664.
Kass M, Witkin A, Terzopoulos D. Snakes: Active contour
models. Int. J. Comp. Vis., 1: 321-331, 1987.
Kambhamettu C, Goldgof DB. Curvature-Based Approach to
Point Correspondence Recovery in Conformal Nonrigid Motion.
CVGIP: Image Understanding, 60(1): 26-43, 1994.
Lachaud JO, Montanvert A. Deformable meshes with automated
topology changes for coarse-to-fine three-dimensional surface
extraction. Med. Image Anal., 3(2): 187-207, 1999.
Lelieveldt BPF, van der Geest RJ, Ramze Rezaee M, Bosch
JG, Reiber JHC. Anatomical model matching with fuzzy implicit
surfaces for segmentation of thoracic volume scans. IEEE
Trans. Med. Imag., 18(3): 218-230, 1999.
Liang J, McInerney T, Terzopoulos D. Interactive medical
image segmentation with United snakes. In Lecture Notes
in Computer Science 1679: Medical Image Computing and Computer-Assisted
Intervention, MICCAI99, C. Taylor, A. Colchester, Editors,
Spriner, 1999, 116-127.
Lötjönen J, Reissman PJ, Magnin IE, Katila T. Model extraction
from magnetic resonance volume data using the deformable
pyramid. Med. Image Anal., 3(4): 387-406, 1999.
Lötjönen J, Mäkelä T. Elastic matching using a deformation
sphere. Medical image computing and computer assisted intervention
2001. (in press)
Maes F, Collignon A, Vandermeulen D, Marchal G, Suetens
P. Multimodality image registration by maximization of mutual
information. IEEE Trans. Med. Imag., 16(2): 187-198,
1997.
Malladi R, Sethian JA, Vemuri BC. Shape modeling with front
propagation: A level set approach. IEEE Trans. Pattern
Anal. Machine Intell., 17(2): 158-175, 1995.
McInerney T, Terzopoulos D. Deformable models in medical
image analysis: a survey. Med. Image Anal., 1(2):
91-108, 1996.
Mitchell SC, Lelieveldt BPF, van der Geest RJ, Bosch HG,
Reiber JHC, Sonka M. Multistage Hybrid active appearance
model matching: Segmentation of left and right ventricles
in cardiac MR images. IEEE Trans. Med. Imag., 20(5):
415-423, 2001.
Nastar C, Ayache N. Frequency-based nonrigid motion analysis:
Application to four dimensional medical images. IEEE
Trans. Pattern Anal. Mach. Intell, 18(11): 1067-1079,
1996.
Pentland A, Horowitz B. Recovery of nonrigid motion and
structure. IEEE Trans. Pattern Anal. Machine Intell.,
13(7): 730-742, 1991.
Pluim JPW, Maintz JBA, Viergever MA. Image registration
by maximization of combined mutual information and gradient
information. IEEE Trans. Med. Imag., 19(8): 809-814,
2000.
Rueckert D, Sonoda LI, Hayes C, Hill DLG, Leach MO, Hawkes
DJ. Nonrigid registration using free-form deformations:
Application to breast MR images. IEEE Trans. Med. Imag.,
18(8) 712-721, 1999.
Staib LH, Duncan JS. Model-based deformable surface finding
for medical images. IEEE Trans. Med. Imag., 15(5):
720-731, 1996.
Szekély G, Kelemen A, Brechbühler, Gerig G. Segmentation
of 2-d and 3-d objects from mri volume data using constrained
elastic deformations of flexible fourier contour and surface
models. Med. Image Anal., 1(1): 19-34, 1996.
Xu C, Pham DL, Rettmann ME, Yu DN, Prince JL. Reconstruction
of the human cerebral cortex from magnetic resonance images.
IEEE Trans. Med. Imag., 18(6): 467-480, 1999.

 Home
Current Issue
Table of Contents
Home
Current Issue
Table of Contents
