|
Mathematical Model of the
Electrical Activity of Ventricular Cell:
Regional Differences and Propagation
Z. Li, H. Zhang, A. V. Holden, and C. H. Orchard
School of Biomedical Sciences, University of Leeds, LS2 9JT, UK
Correspondence: Lizzie@cbiol.leeds.ac.uk
Abstract. The characteristics of
electrical activity of isolated cells from guinea-pig ventricular wall
show regional differences. These regional differences are assumed to be
results of regional differences in membrane ionic current densities. Mathematical
models incorporating the experimental data of variable ionic current densities
are able to reproduce the regional differences in action potentials. In
one-dimensional model of intact ventricular tissue, electrotonic interactions
between cells reduced regional differences shown in isolated single cells.
Keywords: Guinea-pig, Ventricular myocardium, Regional differences.
Introduction
In recent years, extensive studies have found
that there are regional differences in the electrical activities of mammalian
ventricular myocytes. Electrical activities of cells isolated from sub-epicardial
and sub-endocardial myocardium show different characteristics. Such regional
differences are species dependent. In the heart of canine
[1,
2,
3], feline
[4,
5], rabbit
[6], rat
[7,
8], and human
[9,
10]
action potentials of endocardial ventricular cells have a longer action
potential duration (APD), higher amplitude (AM), and more negative resting
potential (RP) than those of epicardial cells. In some species, electrical
activities of epicardial cells have a spike-and-dome morphology, which
is absent in endocardial cells. The mechanisms underling such regional
differences are unclear. It has been assumed that such regional differences
may result in the variability of the membrane ionic current densities.
For example, experimental data have shown that in the ventricle of canine's
heart, epicardial cells have a larger ionic current density and a faster
speed of inactivation of outward transit current Ito
[2].
The difference in the morphology of action potential between epicardial
cells and endocardial cell may be due to the regional difference of Ito:
both the current density and gating speed. Experimental data have also
shown that there is a large difference in the ionic current densities of
slowly and rapidly activated delayed rectifier potassium current IKr
and IKs
[2],
and their associated channel kinetics between epi- and endo-cardial ventricle
cells. Regional differences in action potential durations of epi- and endo-cardial
ventricle cells may be due to the cooperative effect of regional differences
in IKr, IKs and Ito
[11].
In guinea-pig ventricle, unlike those of other species, electrical activities
of cells isolated from different regions of ventricular wall show no significant
difference in action potential configuration, such as the spike-and-dome
morphology, and the resting potential. However, it has been found that
the action potential durations at 50% (APD50) and 90% (APD90)
repolarization are significantly shorter in subepicardial myocytes than
in subendocardial myocytes
[12,
13,
14].
In other species, Ito contributed to the differences in the
action potential configuration. In guinea-pig ventricular cells, experiments
have failed to find evidence for the existence of Ito
[15,
16,
17].
The difference in APD is assumed to be mainly due to the relative densities
of IKr and IKs, and their associated channel kinetics
[13,
14].
To test this hypothesis, we constructed mathematical models for endo- and
epi-cardial ventricular cells of guinea-pig heart. These models incorporate
the experimental data of regional differences of ionic current densities.
The model action potentials show the same characteristics of action potentials
and their regional differences as those recorded from cells isolated from
epi- and endo-cardial ventricular cells of guinea-pig heart.
In intact ventricle, the recorded electrical activity from different
region did not show the same remarkable regional differences as seen in
isolated cells
[18].
Such a significant quantitative difference has raised a question, whether
or not regional differences shown in the electrical activity of epi- and
endo-cardial ventricle cells is due to the intrinsic properties of cells,
or due to damage of cells in the process of isolation during experiments?
If it is an intrinsic property of cells, what is the mechanism underlying
such an apparent disagreement between the data obtained from isolated cells
and intact ventricle? In other words, what is the reason for the regional
difference to disappear in the intact ventricle? We approach this question
computationally. Here we constructed a one-dimensional model of a transmural
string of ventricular wall, extending from the endo- to epicardium. The
one-dimensional model incorporates the heterogeneity in the electrical
activity of ventricular cell. It is shown that, due to the electrotonic
interactions, the regional differences in action potential characteristics
recorded from different sites are reduced.
Methods - Model development
Single cell models
Models of electrical activity of epi- and endo-ventricular cells of
guinea-pig heart are based on modifications of a standard model of electrical
activity of guinea-pig ventricular cell
[19,
20].
The models consist of a set of ordinary differential equations derived
from the results of extensive electrophysiological experiments on guinea-pig
ventricular myocytes. It represents voltage-dependent ionic currents, pump/exchanger
currents, time dependent changes in intracellular and extracellular ionic
concentrations, and storage and release of Ca2+ by intracellular
organelles. In the models we incorporated the published experimental data of Bryant et al.
[14]
on the ionic current densities measured in isolated guinea-pig ventricular
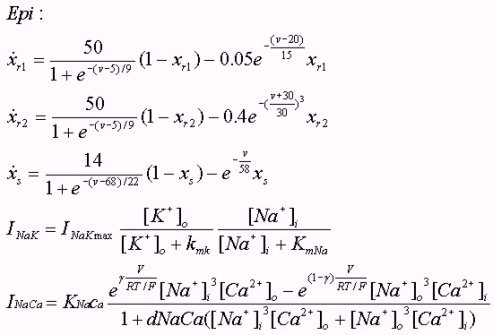
endocardial and epicardial cells. The magnitudes of the Na+-K+
pump and exchange currents were also modified. The equations, together
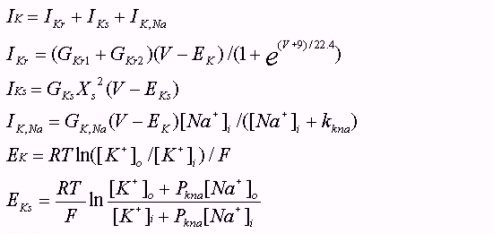
with the parameter values, are listed in the Appendix.
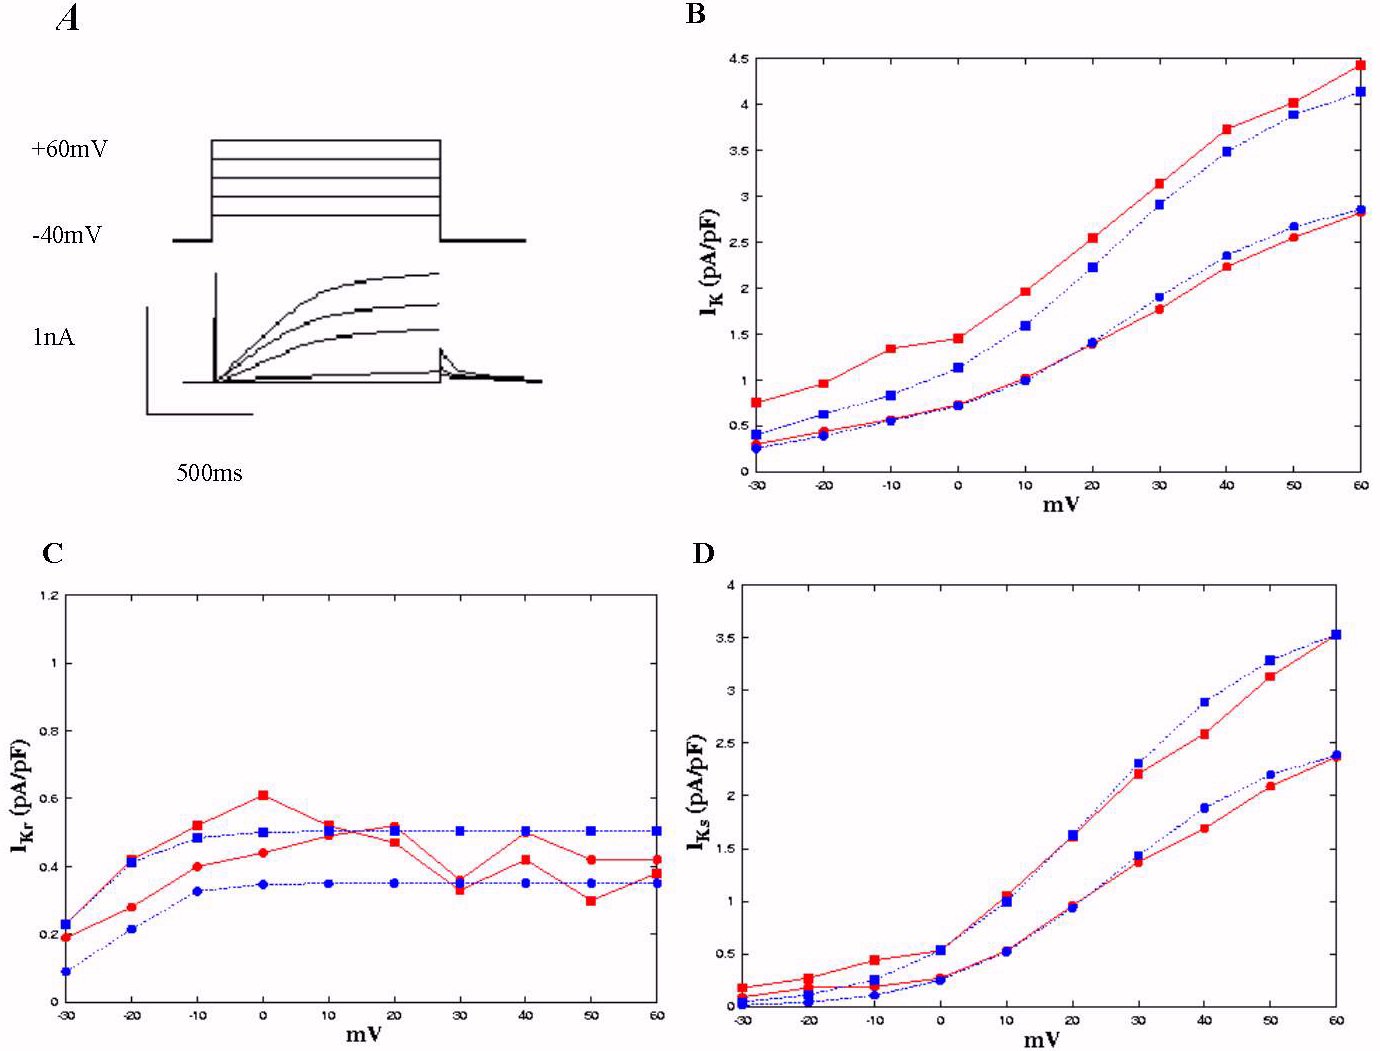
Figure 1: Delayed rectifier tail current densities in endo-
(circles) and epicardial (squares) cells of guinea-pig ventricle: experimental data (red lines)
[14]
and computed results (blue lines). Panel A, shows am example of the protocol
used to elicit time-dependent and tail currents, which were elicited upon
repolarisation to -40 mV after a 1 s step depolarisation to -20 mV, 0 mV,
+20 mV, +40 mV, and +60 mV from a holding potential of -40 mV. Panel B,
C and D, current-voltage relationship curves for IK, IKr
and IKs tail currents.
Based on the experimental data of Bryant et al.
[14],
we modified the kinetics of IKr and IKs, and also
incorporated their regional dependent ionic current densities in our epi-
and endo-ventricular models. To do that, we simulated voltage clamp experiment
with a same protocol as used in experiments. The current-voltage relationship
curves were simulated to fit the experimental data by choosing value of
the ionic conductance of GKr1, GKr2 (fast and slow
components of IKr) and GKs and the rates of activation
and inactivation of IKr and IKs for endo- and epicardial
ventricular cells.
Figure 1 shows the simulation of the voltage clamp experiment, and comparison
with the experimental data of Bryant et al.
[14].
In Figure 1A, the top panel shows the voltage clamp protocol. The cell
membrane potential is clamped from a holding potential of -40 mV to +60
mV for 1 s duration. The bottom panel shows the time trace of IK.
In figure 1B, we plotted the I-V relationship of IK. The current
density of IK is estimated by the peak tail current at the end
of the test pulse. In the figure, filled square with solid line represents
the data computed from the epi-cardial cell mode, filled circle with solid
line represents the computed data from endo-cardial model; filled square
with dash line represents the mean data obtained from epicardial cells,
filled circle with dash line represents the mean data obtained from endocardial
cells. Our computed data fitted quite well with the experimental data.
Figure 1C plots the I-V relationship of IKr, and comparison
with experimental data. In the figure, solid square with solid line is
the data from epicardial cell model, filled circle with solid line is the
data from endocardial cell model. The computed data for both epi- and endocardial
cells are within the experimental range of the mean data obtained from
epi- (solid square with dashed line) and endo-cardial cells (solid circle
with dashed.).
In Figure 1D, we plotted the computed I-V relationship of I Ks,
and comparison with experimental data. Once again, solid squares represent
the data from epicardial cell model (with solid line) and the mean data
from epicardial cells (with dashed line); solid circles represents the
data from endocardial cell model (with solid line) and the mean data from
endocardial cells. For both the epi- and endocardial cell models, the computed
data are consistent with the experimental data.
Table 1 lists the experimental data (mean + S.E.M.) of ionic current
densities of IK, IK,r and IK,s obtained
from n cells isolated from epi-cardial and endo-cardial ventricular cell
(n changes from 9 to 12). Our model generated data are also listed. The
model generated data are within the range of experimental data.
TABLE 1: Regional differences in the delayed rectifier current
in guinea-pig ventricular myocytes between experimental data and our modelling result
[14]:

IK is tail currents elicited upon repolarisation to -40 mV
after 1s step depolarisaton to either -30 mV or +60 mV. IK is
tail current density measured in normal Tyrode. IKs = defetilide-insensitive
tail current density and IKr = defetilide-sensitive tail current
density.
One dimensional model incorporating heterogeneity
A one-dimensional model of a transmural string of ventricular wall takes
the form of partial differential equation. In the model we incorporated
the heterogeneities of ionic current densities. We assumed that the length
of string is 16 mm. In the string, cell capacitance changes linearly from
132 pF at the epicardial to 142 at the endocardial end. The ionic current
densities are linear functions of cell capacitance. Electrotonic interactions
between cells are through diffusive interactions of membrane potentials.
The model takes the form:
| |
 |
(1) |
in which, V (x,t) is the membrane potential of a node at x
distance from the end of epicardium, D is the diffusion coefficient
for V, ∇2 is
the Laplacian operator. In numerical simulation, the partial differential
equation is solved by a 3-node Laplacian operator, and a time step dt
of 0.1 ms, space step dx of 0.32 mm. The diffusion coefficient D
was set to 256 mm2s-1 to give a conduction velocity
of 0.3 ms-1.
Results
Simulated action potentials and their regional differences
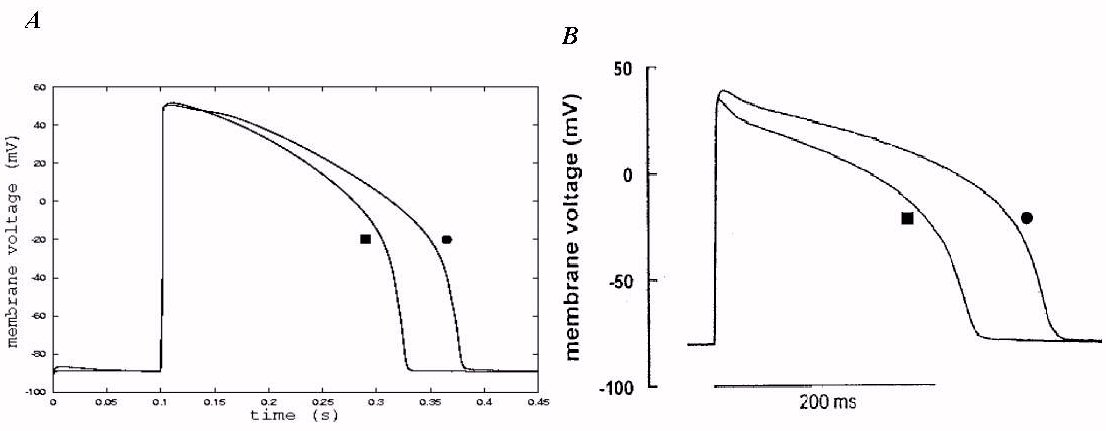
Figure 2: Action potentials of the endo- (circle) and epicardial
(square) cells of guinea-pig ventricle: (A) simulated result (B) experimental data
[14]
Figure 2A shows the model generated action potentials of epi- and endo-ventricular
cells (circle for endocardial cell; square for epicardial cell) in response
to a supra-threshold stimulus. The model action potentials are compared
with action potentials recorded from epi- and endo-cardial ventricular
cells of guinea pig heart (Figure 2B). In both simulation and experimental
recording, action potential of epi-cardial cell has significantly shorter
APD than that of endocardial cell. However, there is no difference in resting
potential. In simulation, there is no difference in the amplitude of action
potentials, however, in experimental recording, there is noticeable difference
in the amplitude. Difference in the amplitude may result in other ionic
currents involved, such as the sustained background sodium current
[14].
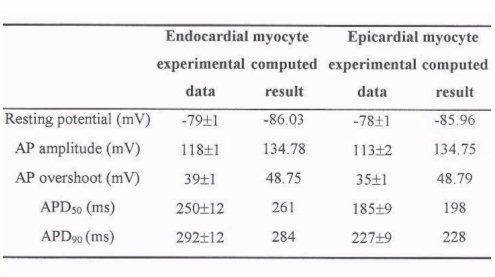
Table 2 gives detailed comparison of characteristics of action potentials
of epi- and endocardial ventricular cells. In the table, the experimental
data are in mean + S.E.M (n changes from 30 to 40) format. From the table
we can see that our model generated action potentials of epi- and endo-cardial
ventricular cells have the same region characteristics as those recorded
experimentally. The model generated action potential duration (APD) is
shorter in the epicardial myocytes than in the endocardial myocytes. APD
measured at 50% and 90% repolarization were longer in endocardial myocytes
than in epicardial myocytes either in the experimental data and computed
results: with a stimulation interval of 5000 ms, the action potential duration
measured at 50% repolarization (APD50) from the endocardial
and epicardial cell models was 261 ms and 198 ms, which are consistent
with the experimental results of 250 ±
12 and 185 ± 9 ms, and the APD90
was 284 ms and 228 ms, while the experimental results are 292 ±
12 and 227 ± 9 ms. There is no significant
difference in the simulated AP resting potential and amplitude.
TABLE 2: Regional differences in the characteristics of action
potentials of guinea-pig
ventricular cells between experimental data
[14]
and computed results:
It is known that characteristics of action potential of guinea-pig ventricular
cells are rate dependent. If a second action potential is initiated soon
after the first, the second action potential in found considerably shorter
in action potential duration. Such rate dependence can been illustrated
by a restitution curve
[21,
22].
Here we investigate a possible regional difference in the rate dependence
between epi- and endo-cardial cells, as a result of regional difference
in their ionic current densities. In figure 3, we plot the normalized action
potential duration against the time interval between two successive stimuli.
In the figure, circle represents data computed from epicardial cell model,
while square represents data computed from the endocardial cell model.
With a slow stimulus rate (a longer time interval), there is no differences.
With a high stimulus rate (a small time interval), the difference becomes
noticeable.
Figure 3: Computer modelling of restitution curves of the endo-
(circle) and epicardial (square) cells of guinea-pig ventricle.
Propagation of electrical activity in one-dimensional model
In one dimensional model of a string of transmural ventricular tissue,
intrinsic electrical activity of cells along the string show gradient characteristics
as shown in Figure 4A. Action potentials from various points along the
string are shown. In numerical simulation we set the cell to cell coupling
coefficient to zero, and stimulate all cells in the string simultaneously
with a supra-threshold. The excited action potential is displaced from
top (0 mm: endocardial) to bottom (16 mm: epicardial). From the endocardial
to the epicardial end, the action potential duration decreases gradually.
The measured APD90 was 284 ms and 228 ms from isolated endocardial
and epicardial cells. The difference in APD90 is significant.
However, when cells are coupled together, the difference in APD90
between endocardial and epicardial cells is reduced. This is shown in figure
4B, in which action potentials along the length of string are shown. In
this case, a supra-threshold stimulation is applied at the endocardial
end. The evoked excitation wave propagates from endocardium to epicardium.
Due to the electronic interactions, the regional differences in action
potential duration were partly reduced when electrical activity propagating
through the heterogenous guinea-pig ventricular wall: the measured APD90
was 282 ms at the end of endocardium and 271 ms.
In the simulation shown in figure 4B, although electrotonic interaction
reduced the difference in action potential duration between the endocardial
and epicardial cells, however, the sequence of depolarisation and repolarisation
is consistent with experimental observations. In the figure, we can see
the depolarisation starts from endocardial side, and moves towards the
epicardial side, while repolarisation starts from epicardial side, moves
towards the endocardial side.
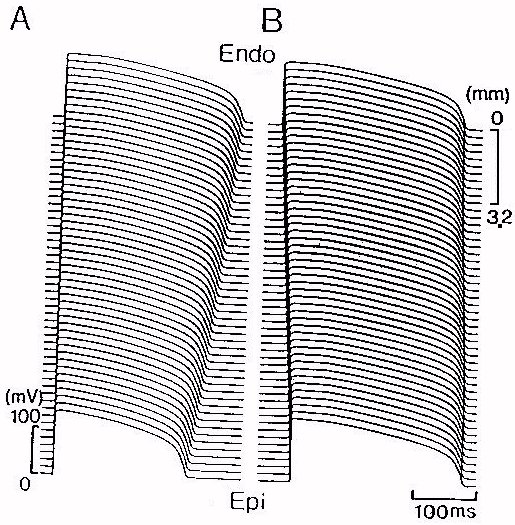
Figure 4: Computed action potentials along the length of (A) isolated
cells (B) a string of guinea-pig ventricular muscle from endocardium to
epicardium. A supra-threshold stimulation is applied at the endocardial
end. The evoked excitation wave propagates from endocardium to epicardium.
Due to the electronic interactions, the regional differences in action
potential duration along the string were reduced: the measured APD90
were 282 ms at the end of endocardium and 271 ms at the end of epicardium,
while 284 ms and 228 ms from isolated endocardial and epicardial cells.
Figure 5 illustrates quantitatively the changes of dispersion of action
potential duration along the string by the electrotonic interactions between
cells. In the figure, squares represent the data of isolated cells, circles
represent the data of intact transmural string. Electrotonic coupling decreases
the transmural dispersion of action potential duration.
Figure 5: Computed action potential duration measured at 90 %
repolarization (APD90) in isolated cells (red) and a string
(blue) from endocardium to epicardium in guinea-pig ventricle. Electronic
interactions between cells smooth the heterogeneity of the characteristics
of action potential duration.
Conclusions
Models incorporating the experimental data of
regional differences on ionic current densities of guinea-pig ventricle
cells have been developed. The model generated action potentials have the
same regional differences as those recorded experimentally. Our modelling
work supports the hypothesis that the regional differences in the electrical
activities of ventricular cells are results of the regional differences
in the intrinsic properties of cells through the ventricular wall. In one-dimensional
model, we showed that electrotonic interactions between cells smooth the
heterogeneity through the wall. It helps to explain "why the electrophysiological
properties of different myocardial sites differ so markedly at the level
of the isolated tissue and single cell and yet become so much more homogenous
in the intact ventricle"
[18].
The cell to cell coupling coefficient we used here is reasonable, with
it, the conduction velocity of action potential of the string is 0.3 ms-1,
which is consistent with the experimental data. In the model, the computed
sequence of depolarisation and repolarisation is consistent with experimental
observation, which validates that our one-dimensional model is a reasonable
approximation of intact transmural ventricular tissue.
Appendix
Single cell models for endo- and epicardial of guinea-pig ventricular myocytes*:
Units
| s |
second |
time |
| mm |
millimetre |
space |
| mV |
millivolt |
potential |
| uF |
microfarad |
capacitance |
| uS |
microsiemen |
conductance |
| nA |
nanoampere |
current |
| mM |
mole per litre |
concentration |
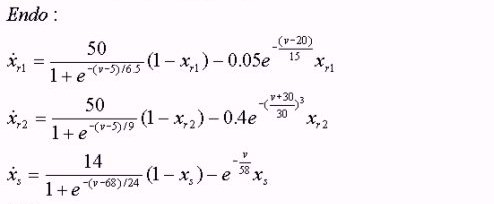
Independent dynamic variables
V- transmembrane voltage, mV;
xr1, xr2, xs - gating variables, 0
to 1;
[Na+]i, [K+]i, [Ca2+]i
- intracellular ion concentrations, mM;
[Na+]o, [K+]o, [Ca2+]o
-
extracellular ion concentrations, mM.
Differential equations for endo- and epicardial
 Standard parameter values
| Cm (endo) |
142(10)-6 uF |
| Cm (epi) |
132(10)-6 uF |
| [Na+]o |
140 mM |
| [K+]o |
4 mM |
| GKs (endo) |
0.0013 uS |
| GKs (epi) |
0.0020 uS |
| GKr1 (endo) |
0.0008 uS |
| GKr1 (epi) |
0.0010 uS |
| GKr2 (endo) |
0.0004 uS |
| GKr2 (epi) |
0.0008 uS |
| KNaCa (endo) |
0.0003 nA |
| KNaCa (epi) |
0.0001 nA |
| INaKmax (endo) |
0.14 nA |
| INaKmax (epi) |
0.12 nA |
*Our cell models are based on the Nobel et al. model [19] with modifications
as shown in the appendix.
References
[1]
Liu, D.W., Gintant, G.A. and Antzelevitch, C., "Ionic bases for electro-physiological
distinctions among epicardial, mid-myocardial, and endocardial myocytes
from the free wall of the canine left ventricle", Cir Res. 72: pp. 671-687,
1993.
[2]
Liu, D.W. and Antzelevitch, C., "Characteristics of the delayed rectifier
current (IKr and IKs) in canine ventricular epicardial,
midmyocardial, and endocardial", Cir Res. 76: pp. 351-365, 1995.
[3]
Sicouri S. and Antzelevitch, C., "Electrophysiologic characteristics of
M cells in the canine left ventricular free wall", J.Cardiovasc Electrophysiol.
6: pp. 591-603, 1995.
[4]
Kimura, S., Bassett, A. L., Furukawa, T., Cuevas, J. and Myerburg, R. J.,
"Electrophysiological properties and responses to simulated ischemia in
cat ventricular myocytes of endocardial and epicardial origin", Cir Res.
66: pp. 469-477, 1990.
[5]
Furukawa, T., Myerburg, R.J., Furukawa, N., Bassett, A.L. and Kimura, S.,
"Differences in transient outward currents of feline endocardial and epicardial
myocytes", Cir Res. 67: pp. 1287-1291, 1990.
[6]
Fedida, D. and Giles, W.R., "Regional variations in action potentials and
transient outward current in myocytes isolated from rabbit left", J. of
Physiology -London 442: pp. 191-209, 1991.
[7]
Clark, R.B., Bouchard, R.A., Salinasstefanon, E., Salinasstefanon, E.,
Sanchezchapula, J. and Giles, W.R., "Heterogeneity of action potential
waveforms and potassium currents in rat ventricle", Cardiovascular Res.
27: pp. 1795-1799, 1993.
[8]
Shipsey, S.J., Bryant, S.M. and Hart, G., "Effects of hypertrophy on regional
action potential characteristics in the rat left ventricle - A cellular
basis for T- wave inversion?", Circulation 96: pp. 2061-2068, 1997.
[9]
Nabauer, M., Beuckelmann, D.J., Uberfuhr, P. and Steinbeck, G., "Regional
differences in current density and rate-dependent properties of the transient
outward current in subepicardial and subendocardial myocytes of human left
ventricle", Circulation 93: pp. 168-177, 1996.
[10]
Wettwer, E., Amos, G.J., Posival, H. and Ravens, U., "Transient outward
current in human ventricular myocytes of subepicardial and subendocardial
origin", Cir Res. 75: pp. 473-482, 1994.
[11]
Litovsky, S.H. and Antzelevitch, C., "Transient outward current prominent
in canine ventricular epicardium but not endocardium", Cir Res. 62: pp.
116-126, 1988.
[12]
Bryant, S.M., Shipsey, S.J. and Hart, G., "Regional differences in electrical
and mechanical properties of myocytes from guinea-pig hearts with mild
left ventricular hypertrophy", Cardiovascular Res. 35: pp. 315-323, 1997.
[13]
Main, M.C., Bryant, S.M. and Hart, G., "Regional differences in action
potential characteristics and membrane currents of guinea-pig left ventricular
myocytes", Experimental Physiology 83: pp. 747-761, 1998.
[14]
Bryant, S.M., Wan, X.P., Shipsey, S.J. and Hart, G., "Regional differences
in the delayed rectifier current (IKr and IKs) contribute
to the differences in action potential duration in basal left ventricular
myocytes in guinea-pig", Cardiovascular Res. 40: pp. 322-331, 1998.
[15]
Hirano, Y. and Hiraoka, M., "Barium-induced automatic activity in isolated
ventricular myocytes from guinea-pig heart", J. of Physiology - London
395: pp. 455-472, 1988.
[16]
Ryder, K.O. Bryant, S.M. and Hart, G., "Membrane current changes in left-ventricular
myocytes isolated from guinea-pig heart after abdominal aortic coarctation",
Cardiovascular Res. 27: pp. 1278-1287, 1993.
[17]
Coraboeuf, E., Coulombe, A., Deroubaix, E., Hatem, S. and Mercadier, J.J.,
"Transient outward potassium current and repolarization of cardiac cells",
Bulletin de l Academie nationale de Medecine 182: pp. 325-335, 1998.
[18]
Anyukhovsky, E.P., Sosunov, E.A., Gainulin, R.z. and Rosen, M.R., "The
controversial M cell", J. Cardiovascular Electrophysiology 10: pp. 244-260,
1999.
[19]
Noble, D., Varghese, A., Kohl, P. and Noble, P., "Improved guinea-pig ventricular
cell model incorporating a diadic space, IKr and IKs,
and length- and tension- dependent processes", Canada J. of Cardiology
14: pp. 123-134, 1998.
[20]
Oxford cardiac electrophysiology group. Oxsoft HEART version 4.8 manual;
Oxford: Oxsoft, 1997.
[21]
Bjornstad, H., Tande, P.M., Lathrop, D.A. and Refsum, H. "Effects of temperature
on cycle length- dependent changes and restitution of action potential
duration in guinea-pig ventricular muscle", Cardiovascular Res. 27: 946-950,
1993.
[22]
Boyett, M.R. and Fedida, D. "Changes in the electrical activity of dog
cardiac Purkinje fiber at high rates", J. Physiol. 350: pp. 361-391,1984.
|

 Home
Current Issue
Table of Contents
Home
Current Issue
Table of Contents