V. Novak and J. Neumann
Introduction
The purpose of the plan described in this contribution is the simulation
and subsequently the review of the dynamic processes running on subcellular
level in the electromechanical heart contractile system. These processes
can be seen on the very simplified scheme of the electromechanical heart
contractile system (see fig. 1). In the first part
of our research project we have focused on the formulation of the mathematical
model of the biochemic-mechanical subsystem (which is described in this
paper).
Figure 1. Electromechanical heart contractile
system - simplified scheme
Basic information that enables us to build a suitable model is the description
of the biochemical bindings in a sarcomere [1,2,14].
This description is divided into two main blocks of the biochemical reactions.
The first block of the reactions, placed in the Table
1, describes the bindings in the contractile system (i.e. among Actin
(A), Myosin (M) and structures of Adenosinetriphosphate (ATP)) The second
block, stated in the Table 2, describes the regulation
system, thus relations between intracellular calcium Ca2+i
and troponin C (TnC).
TABLE 1. The actomyosin system
TABLE 2. The regulation system
By expressing of the biochemical reaction's kinetic behaviour, the system
of ten ordinary non-linear 1st order differential equations
can be derived with constant coefficients - rate constants, denoted as
"k", of biochemical reactions mentioned above and which represent also
the parameters of the mathematical model (see Table 3).
TABLE 3. Mathematical Model
The model, presented in Matlab, allows precarious definition of a set
of experiments differing from each other by values of observed parameters,
initial conditions, etc.
Detailed investigation of its dynamic properties has shown that the
model is stable, stiff with plenty of linear loops. This fact is characteristic
for a specific class of mathematical models of biological systems. The
full-scale description of model's dynamic properties can be found in [3]
and [4].
Dynamic changes of intracellular calcium concentraction [Ca2+]i,
which are resultants of the outward action potential course and relating
ion currents, were in this model due to simplification substituted by the
time course of an ideal rate change of a concentration of the intracellular
calcium released out of the JSR (Junctional Sarcoplasmic Reticulum) d[Ca2+F]/dt
(see Figure 2) - the only one input signal of
the model, whose mathematical characteristics (e.g. amplitude) were chosen
to fit the steady state value of [Ca2+]i and maximal
value of [Ca2+]i (before maximal contraction) during
simulation according to present physiological experiments in vitro [5,
6].
Here should be denoted, that the contributions of intracellular calcium
ions non-accumulated in the sarcoplasmic reticulum and therefore passing
through the cell membrane directly into sarcomere and other phenomenons
like mitochodria are in this model presently neglected.
Figure 2. The input signal curve representing the ideal time course
of the rate of the calcium ions release out of JSR (here is, naturally,
the amount of calcium ions released out of the JSR [Ca2+F]
identical to the amount of calcium ions entering the intracellular space
[Ca2+i])
In the Figure 2 are the points of simulation
start, stop, model's end of the transient response and the value ensuring
the right heart beat frequency (70 1/min), marked by means of indexes START,
STOP, S and b. The puls width (100 ms) represents the duration of
calcium release out of the JSR.
The model's basic ability to reach a significant conformance with physiological
experimental measurements was qualitatively verified by comparing the simulation
of the [Ca2+]i course (see Figure 3)
with the same one, but measured in vitro (see Figure 4)
on a rabbit's heart cell [7]. Quantitative verification
can only be performed constraintly with knowledge of great variability
of physiological measurement results especially dependent on the method
applied.
Figure 3. Transient curve of the intracellular calcium [Ca2+i]-
simulation result (tS shows the point of the model's end of
transient response)
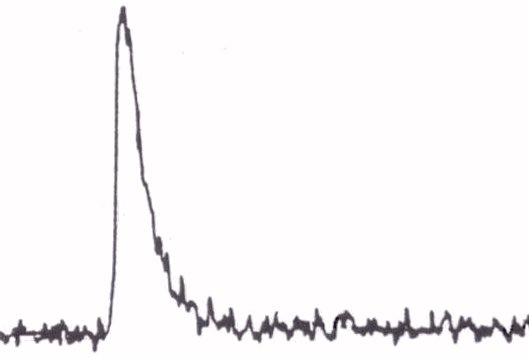
Figure 4. Transient curve of intracellular calcium [Ca2+i]
measured in vitro The calcium steady state value is not in this figure
denoted
Methods
Following dynamics depends on the quantity of biochemical parameters
some of which have physiological and medical meaning and thus offer great
number of degrees of freedom on selection the simulation experiments. Variability
of simulation experiments with respect to mentioned biochemical parameters
embodies a number of variations following from the definition of the parameter's
vector (1):
| P = (kan, kab, kDPA,
k –DPA, k –DAP, k –AD, kAT, k –AT,
k –TA, kTA, kAH, k –AH, kH,
k –H, kr) |
(1) |
where the rate constant kan represents the rate of association
of Ca2+ ions on the specific asociation sites on troponin C
(TnC), kab represents the rate of dissociation of Ca2+
ions from the specific binding sites on TnC, kH represents the
rate of rending of ATP (adenosintriphosphate) to ADP (adenosindiphosphate)
and a phosphor molecule, k –H represents the rate of reverse
reaction, kDPA represents the rate of forming the crossbridge
in the weak binding form, k –DPA represents the rate of reverse
reaction, k –DAP represents the rate of forming the crossbridge
in the strong binding form, k –AD represents the rate of rending
of ADP molecule from the myosin's head, kAT represents the rate
of transformation of crossbridge from strong to weak form after binding
the ATP molecule, k –AT represents the rate of reverse reaction,
kTA represents the rate of binding of myosin's head with ATP
molecule on the actin molecule, k –TA represents the rate of
reverse reaction, kAH represents the rate of hydrolysis of ATP,
k –AH represents the rate of reverse reaction, kr
represents the rate of active transport of Ca2+ ions form sarcomere
into sarcoplasmic reticulum (into NSR - Network Sarcoplasmic Reticulum
[8]).
Standard physiological reality obtained by in vitro experiments reflects
the element's values in vector (1) marked as Pref
[9,
10,
11,
12,
13].
Naturally values of these elements in Pref were
not measured during a single physiological experiment and thus show some
variance with respect to definition of laboratory conditions (t, pH) and
to animal class (heart myocyte of rabbit, guinea pig, cattle, etc.). With
respect to difficulty of laboratory experiments and thus availability of
corresponding measuring results we have to admit this non-uniformity in
the definition of the vector
Pref.
Simulated changes in dynamics of phenomenons running in the electromechanical
heart contractile system can be achieved by apriori changes of positions
of the P point (defined by vector P) in 15
dimensional parametric space. A well known problem of every mathematical
model simulating a biological system is the problem of ranges of physiological
interpretation, it means definition of suitable set of positions of P
regarding experimentally verified position of Pref.
While mathematics allows to simulate with geat ranges of parameter's values
and is only restricted by model's dynamic properties (e.g. numerical unstability),
borders of physiological reality are the subset of mathematical borders
and can only be discovered as a result of experimental measurements in
vitro, which are not in many cases available. From these reasons the variability
of parameters kr, kan, kab, which influence
significantly [Ca2+]i and [TnC] and they are succefully
physiological interpretable, was investigated. By means of this selection
the number of degrees of freedom of the observed dynamics was also indispensably
reduced. A great problem before own simulation is setting all initial conditions
in the model because most of them are not known. We found experimentally,
that after implementing the Pref into model and
after setting those well-known initial conditions, the model reaches the
steady state in time no longer than 2 seconds. Therefore the input signal
(defined by rectangular shape with amplitude of 480 [uM/s] and pulse width
of 100 msec) starts at 2 seconds after begin of simulation (Figure
2). All simulations presented in this contribution were performed under
the same conditions: begin of simulation = 0 seconds, total time = 4 seconds,
sample period = 0.00001 seconds, integration method Gear, tolerance = 0.0001
seconds. The model was simulated on a two PENTIUM III processors workstation
based on Windows NT and Matlab 5.
Results
Variability of kr. The value of this parameter represents
the rate of active transport [Ca2+]i from a sarcomere
back into the NSR. In our model we use the linear description of calcium
pump (2):
 |
(2) |
The figures 5 and 6 show
the maximal value of [Ca2+]i and minimal value of
[TnC] (both concentrations are in M) as a function of kr, that
is changing from 40 to 400 [1/s] with reference value of 200 [1/s] according
to [6]. One can see, that with increasing rate of calcium
pump, concentraction amplitude of free [Ca2+]i is
decreasing and minimal value of concentration of free (i.e. not occupied)
binding sites on TnC is increasing. This result corresponds with reality
because quicker outflow from sarcomere (increase of kr) results
in rapid decrease of maximal concentration of free intracellular calcium
ions and on the contrary increase of concentration of free Ca-specific
binding sites on TnC. The figures 7 and 8
demonstrate the dependence of concentration of free intracellular calcium
ions and free Ca-specific binding sites on TnC (both in M) in the steady
state on the parameter kr. Hence follows that for reference
value of kr is steady state for [Ca2+]i
equals to 0,1 [uM] [5]. Although the time dependence
of [TnC] is not still experimentally verified, one can read from the graph
the steady state value for [TnC] (approximately 6.78.10-5
[M]). Picture 9 shows the dependence of [Ca2+]i
on the kr and on the time. Here again has to be denoted that
the efflux of the calcium ions out of the JSR is substituted by the input
signal (see Figure 2) and the contributions of
other calcium processes (Na-Ca exchanger, mitochondria) are not presently
in the model included.
Figure 5. Dependence of the intracellular free calcium ions on
the kr parameter values
Figure 6. Dependence of the free Ca-specific binding sites on the
TnC on the kr parameter values
Figure 7. Dependence of the free intracellular calcium in the steady
state on the kr parameter values
Figure 8. Dependence of the Ca-specific binding sites on the TnC
in the steady state on the kr parameter values
Figure 9 - Dependence of the free intracellular calcium ions on
the parameter kr and on the time
Variability of kab. The value of this parameter reflects
the rate of calcium ions dissociation from Ca-specific binding sites on
TnC, which is described by the biochemical reaction (3)
and the differential equation (4).
 |
(3) |
 |
(4) |
The figures 10 and 11
show the maximal value of [Ca2+]i and minimal value
of [TnC] (both concentrations in M) as a function of kab, that
is changing from 20 to 200 [1/s] with reference value of 120 [1/s] according
to [9]. From the figure 10
results that the change of kab initiates non-linear change of
[Ca2+]i so that increasing value of kab
results in decreasing rate of [Ca2+]i growth. Pictures
12
and 13 demonstrate the dependence of concentration
of free intracellular calcium ions and free Ca-specific binding sites on
TnC (both in M) in the steady state on the parameter kab. From
the picture 12 results that real physiological
value of kab should be higher than 60 [1/s], because in this
range does not influence the steady state value of intracellular calcium
concentration. Picture 14 shows the dependence
of [Ca2+]i on kab and on time.
Figure 10. Dependence of the intracellular free calcium ions on
the kab parameter values
Figure 11. Dependence of the free Ca-specific binding sites on
the TnC on the kab parameter values
Figure 12. Dependence of the free intracellular calcium in the
steady state on the kab parameter values
Figure 13. Dependence of the Ca-specific binding sites on the TnC
in the steady state on the kab parameter values
Figure 14. Dependence of the free intracellular calcium ions on
the parameter kab and on the time
Variability of kan. The value of this parameter reflects
the rate of calcium ions association on Ca-specific binding sites on TnC,
which is described by he biochemical reaction (5) and
the differential equation (6).
 |
(5) |
 |
(6) |
The figures 15 and 16
show the maximal value of [Ca2+]i and the minimal
value of [TnC] (both concentrations in M) as a function of kan,
that is changing from 1.1010 to 1.1011
[M-1s-1] with reference value of 4.1010 [M-1s-1]
according to [9]. Figure 15
shows that rate of decrease max[Ca2+]i is decreasing
with the increasing value of parameter kan. Figures 17
and 18 demonstrate the dependence of concentration
of free intracellular calcium ions and free Ca-specific binding sites on
TnC (both in M) in the steady state on the parameter kan. From
the picture 17 results that real physiological
value of kan should be lower than 6.107
[M-1s-1], because in this range does not influence the steady state value
of intracellular calcium concentration. Figure 18
gives us a relatively surprising result because with increasing value of
kan concentration of free Ca-specific binding sites on TnC is
approximately linearly decreasing. Figure 19 shows
the dependence of [Ca2+]i on the kan and
on the time.
Figure 15. Dependence of the intracellular free calcium ions on
the kan parameter values
Figure 16. Dependence of the free Ca-specific binding sites on
the TnC on the kan parameter values
Figure 17. Dependence of the free intracellular calcium in the
steady state on the kan parameter values
Figure 18. Dependence of the Ca-specific binding sites on the TnC
in the steady state on the kan parameter values

Figure 19. Dependence of the free intracellular calcium ions on
the parameter kan and on the time
Conclusions
The results of simulations show that several of investigated dynamic
processes have monoexponential character and offer ability of compartment
formulation with regard to weak non-linearities. Presented changes of [Ca2+]i
and [TnC] also verify rightness of used method. It is clear that other
parameters can be changed or their combinations can be studied and thus
other phenomenons could be investigated, but presently they can not be
verified in vitro. Performed simulation experiments show the dynamic behaviour
of the observed part of the heart contractile system outside the area hitherto
recognized by means of physiological in vitro experiments, i.e. for values
of the vector P # Pref.
In the next stage of the research project we are about to substitute
the model's input signal by enhanced description of intracellular calcium
ions dynamics in cardiomyocyte and then perform coupling with the action
potential.
Acknowledgement
This contribution is the part of a research project supported by
Grant's Agency of Czech republic under No. 106/99/0975.
References
[1] Vander, A. J., Sherman, J. H. and Luciano, D. S., "Human physiology",
McGraw-Hill, New York, 1990.
[2] Poll, R., "Untersuchungen zu erregbaren biologischen Membranen am
Modell eines Herzmuskel-Faserverbandes im Hinblick auf biomedizinische
Gerätelösungen", Forschungsbegleitende Dokumentation, Inst. f.
Biomedizinische Technik d. Technischen Universität Dresden, 1994.
[3] Novak, V., Soukup, J. and Neumann, J., "Dynamic properties of a
system modelling electromechanical contractile heart system", 5th
International Conference on Soft Computing MENDEL'99, Brno, Czech Republic,
1999.
[4] Neumann, J., Novak, V. and Soukup, J., "Mathematical model of electromechanical
heart contractile system", Proceedigs of the 10th International
DAAAM Symposium, DAAAM International, Vienna, Austria, 1999.
[5] Silbernagl, S. and Despopoulos, A., "Taschenatlas der Physiologie",
Georg Thieme Verlag, Stuttgart, 1988.
[6] Takamatsu, T., Wier and W. G., "Calcium waves in mammalian heart,
quantification of origin, magnitude, waveform, and velocity", FASEB J.,
1990.
[7] Fozzard, H. A. et. al, "The heart and cardiovascular system", Raven
Press, New York, 1986.
[8] Meissner, G., "Calcium release and monovalent ion channels in sarcoplasmatic
reticulum incCardiac electrophysiology (From Cell to Bedside)", J. B. Saunders
Company, London, 1990.
[9] Robertson, P. and Johnson, J. D., "The time-course of Ca2+
exchange with calmodulin, troponin, parvalbumin and myosin in response
to transient increases in Ca2+, Biophysical Journal vol. 34,
Biophys. Society, pp. 559-569, 1981.
[10] Tanz, R. D., "Factors influencing myocardial contractility", Academic
Press, 1980.
[11] Fozzard, J. P. and Blinks, J. R., "Intracellular Ca transient in
the papillary Muscle", National Research Council of Canada, 1981.
[12] Landesberg, A. and Sideman, S., "Calcium kinetics and mechanical
regulation of the cardiac muscle", Interactive Phenomena in the Cardiac
System, New York, 1993.
[13] Eisner, D. A., "Control of intracellular ionized calcium concentraction
by sarcolemal and intracellular mechanism", J. Mol. Cell. Cardiol.,pp.
137-146, 1984.
[14] Siemankowsky, R. F. and White, N. D., "Kinetics of the Interaction
between Actin, ADP, and Cardiac Myosin-S1", J. Biol. Chem., Vol. 259, No.
8, pp. 8045 - 8053, 1984.

 Home
Current Issue
Table of Contents
Home
Current Issue
Table of Contents
