A. Steingötter *, O. Dössel*, J. W. Covell***, and A. D. McCulloch**
*Institute of Biomedical Engineering, University of Karlsruhe, 76128 Karlsruhe, Germany
Departments of Bioengineering** and Medicine***, University of California San Diego, La Jolla,
CA 92093-0412, USA
Introduction
A major objective of cardiac bioengineering
is to understand and simulate the electromechanical behavior of the heart.
The creation of computational models of cardiac architecture and physiological
function provides a means of achieving these objectives. For the quantitative
analysis of many aspects of integrated cardiac function, a realistic and
detailed description of cardiac anatomy is needed. Such a realistic
anatomical description should describe internal and external structures
of the atria and ventricles, cardiac wall thickness, myocardial fiber orientation,
coronary arterial and venous networks, the morphology of the conduction
system, the distribution of autonomic nerves and other histological information.
Previous work on modeling cardiac anatomy has concentrated primarily
on the ventricles, especially the left ventricle, due to the critical role
of these chambers in maintaining cardiac pump function and the high mortality
associated ventricular fibrillation. However, atrial arrhythmias such as
atrial flutter and atrial tachycardia are prevalent and carry a risk of
morbidity and mortality, especially due to thromboembolism and stroke.
Because of the complex anatomy and fiber architecture of the atria, previous
techniques used to model ventricular anatomy need to be substantially revised.
The purpose of this paper is to present the measurement of a data set
for the creation of a parametric three-dimensional (3-D) model of atrial
geometry and fiber architecture. The model is intended to will as an anatomical
mesh for the simulation of atrial mechanical and electrical function. A
short introduction on porcine and human atrial anatomy is given and some
anatomical differences between the two species are noted. The preparation
of the pig heart and the strategy to acquire the necessary data are described.
Finally, the strengths and limitations of the approach are discussed and
future directions are suggested.
Atrial Anatomy in Pig and Human
Due to the dissimilar postures of man and pig, the pig heart and the human
heart have a different orientation in the thorax and a different shape.
The posterior and anterior surfaces of the pig heart and human hearts are
also located differently within the thorax. Nonetheless both have an apex
and a base, with upper and lower borders of unequal size [1],
[3], [4]. In the following,
the anatomy of the atria of the human heart and the pig heart is described
and prominent anatomical differences are pointed out.
Right Atrium
External Morphological Structures
The two caval veins, the superior vena cava (SVC) and the inferior vena
cava (IVC), and the coronary sinus (CS) drain deoxygenated blood into the
right atrial chamber. The porcine inferior and superior caval veins usually
open into the atrium at almost right angles to one another, whereas in
man the orifices are almost directly in line [1],
[4].
The right atrial appendage (RAA) or right auricle is the appendicular
portion of the right atrium that externally originates from the terminal
groove. In the pig heart the RAA has a wide tubular appearance and extends
and faces directly in the anterior direction. In man, the RAA has a characteristic
triangular shape and joins the venous component over a broader area . Both
in man and pig, the right atrial appendages are lined internally by pectinate
muscles that originate from the terminal crest [1],
[2], [3], [4].
The venous sinus or sinus venarum is the smooth-walled posterior portion
of the right atrium which receives the IVC and SVC and the orifice of the
coronary sinus. Viewed externally it is relatively small, extending between
the terminal groove and the interatrial groove (Waterston's groove). The
Waterston's groove is the infolding between the venous sinus and the right
pulmonary veins of the left atrium. The major muscle bundle of the venous
sinus, covering the surface of the sinus betweeen the Waterston's groove
and the terminal groove is called intercaval bundle [1],
[2], [5].
Internal Morphological Structures
The tricuspid valve, between the right atrium and right ventricle, has
leaflets supported by the smooth walled, muscular vestibule and the surrounding
fibrous body of the heart. The largest muscular bundle in the right atrium
is the terminal crest or crista terminalis. It is a longitudinal muscular
ridge that originates from the anterior aspects of the septum, swings in
front of the orifice of the SVC and continues downwards to the right of
the orifice of the cavae [2], [3],
[5]. The terminal crest gives rise to the pectinate
muscles and separates the pectinate lining of the appendage from the smooth
walls of the venous sinus [1], [2],
[3], [5].
The natural pacemaker, the sinoatrial (SA) node or sinus node is situated
subepicardially in the superior region of the terminal crest at the junction
of the SVC and the right atrial appendage [6],
[7], [8], [1].
In pig and human, it usually contains more collagen and connective tissue
than surrounding tissue [8], [6],
[9], [10].
The interatrial septum is the muscular wall separating the interior
of the right and left atrium. It mainly consists of the flap valve of the
oval fossa. The oval fossa or fossa ovalis is an oval depression. It represents
a fetal foramen (hole) in the septum which allowed blood to pass from the
right atrium to the left atrium. The principal muscles of the atria attach
to the rim of the oval fossa. The inferior part of the rim is the true
muscular interatrial structure, known as the sinus septum. It separates
the orifice of the coronary sinus from that of the inferior caval vein
and gives rise to the fibromuscular valve guarding the IVC, the Eustachian
valve [1], [2], [3].
The septal region of the pig is longer than in man. This is a result of
the different atrial morphology and also the apparent anterior displacement
of the porcine aortic trunk compared with that of man.
Anteriorly, the sinus septum is continuous with the atrioventricular
septum which contains the apex of the surface of the triangle of Koch.
The entire atrial component of the atrioventricular conduction tissues
is contained within the confines of the triangle [3],
[7], [6 ], [11],
[12]. The atrioventricular (AV) node is located
in an interatrial position some distance above the tricuspid attachment.
The AV bundle penetrates directly at the apex of the triangle of Koch [3],
[11], [9], [12].
Left Atrium
External Morphological Structures
The pulmonary veins (PVs) bring oxygenated blood from the lungs to the
left atrium [3], [4],
[1]. The porcine left atrium receives only two
pulmonary veins, where as the human left atrium receives four PVs. A prominent
left azygous vein (LAZV) enters on the left side of the pig heart. Below
and to the left of the upper left pulmonary vein, the LAZV drains into
the coronary sinus. The comparable vessel in normal human heart is much
reduced. It only persists as the left atrial oblique vein (or left superial
caval vein) so that it normally drains only venous return from a small
part of the left atrial musculature [1].
The left atrial appendage (LAA) or left auricle is the appendicular
portion of the left atrium. In the pig it has a triangular shape and is
of similar size to the right atrial appendage, whereas in human it is of
tubular shape and smaller than the right atrial appendage. As in the RAA,
the LAA is lined internally by pectinate muscles. In pig and man, the pectinate
muscles of the LAA are restricted to the internal walls [1],
[2], [3].
The principal muscular bundles of the left atrial wall are the left
extremity of the interatrial bundle, or Bachmann's bundle, and the septopulmonary
bundle. The septoplumonary bundle belongs to the sinus in the left atrium
[2], [5].
Internal Morphological Structures
The atrioventricular valve between the left atrium and the left ventricle
is called the mitral or bicuspid valve. As in the right atrium, the valve
is supported by the smooth-walled, muscular vestibule and by the surrounding
fibrous ring [1], [2], [3].
Coronary Circulation
The circumferential groove that separates the atrial musculature from the
ventricular musculature is called the atrioventricular (AV) groove or coronary
sulcus. Right and left circumferential coronary artery lie in this groove.
It is incomplete anteriorly and most marked on the right lateral side.
The coronary arterial circulation of the pig is similar to man, whereas
the anatomy of the coronary venous return is very different from that of
the human heart [1]. The most noticeable example
is that no right azygous vein can be found in the porcine heart. Instead
a prominent left azygous vein (LAZV) drains venous blood into the coronary
sinus.
Methods
Animal and Tissue Preparation
All procedures were conducted according to the NIH Institute for Laboratory
Animal Research, 'Guide to the Care and Use of Laboratory Animals'. Procedures
were reviewed and approved by the UCSD Animal Subjects Committee.
The pig heart was perfusion fixed in-situ for 10 minutes using
10% glutaraldehyde. It was isolated with the pericardium intact and parts
of the trachea and the lungs attached. Immediately after the excision,
it was placed in a bath with 10% formalin and was perfusion fixed in-vitro
for another 30 minutes using 10% formalin. Physiological atrial pressures
of 5 mmHg for the right atria and 10 mm Hg for the left atria were applied
during perfusion fixation [13], [14].
The heart was then immersed in 10% buffered formalin and stored there for
one day. Then, the fixed heart was cleaned from tracheal and lung tissue.
The pericardium was removed and the blood vessels were trimmed. Silicone
elastomer that slowly polymerizes over a period of approximately 48 hours
was used to fill the chambers of the pig heart and thus to create a cast.
The viscosity of the silicone elastomer did not allow to injected the material
through atrial vessels without risk of causing major damage to the atrial
walls. Therefore, holes were cut into the right and left ventricle from
where the silicone elastomer was injected via tubing into the right and
left atria, respectively. After atria and ventricles were filled, two parallel
square metal posts were stuck into the silicone cast through the two holes
in the ventricles. The cast heart was again immersed in 10% buffered formalin
with its apex pointing upwards. The heart became securely mounted on the
posts after the silicone had set, see Figure 1.
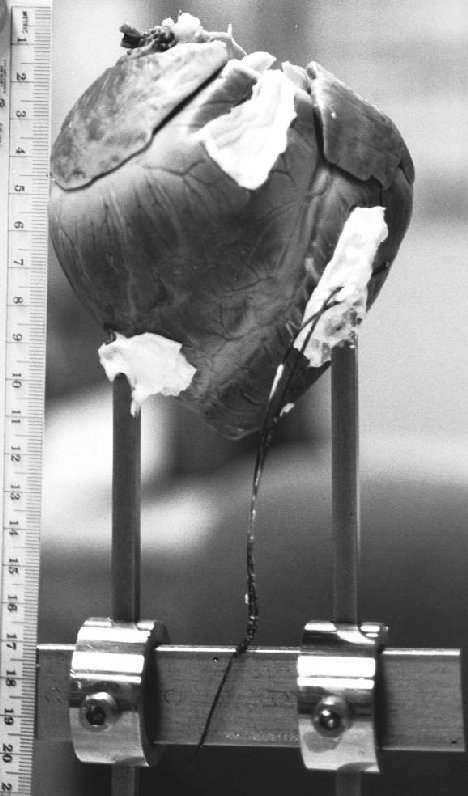
Figure 1. Anterior view of the mounted and cast pig heart.
Measurements
1. A user-specified Cartesian `world coordinate
system' for the 3-D model was established. It was defined with the 6 degree-of-freedom
measurement arm that was also used to digitize the specimen. Every point
in space could be digitized in reference to the fixed measurement arm and
the defined world coordinate system. In addition, a local coordinate system
was created on the stand of the heart to facilitate the display and monitoring
of the actual digitizing process.
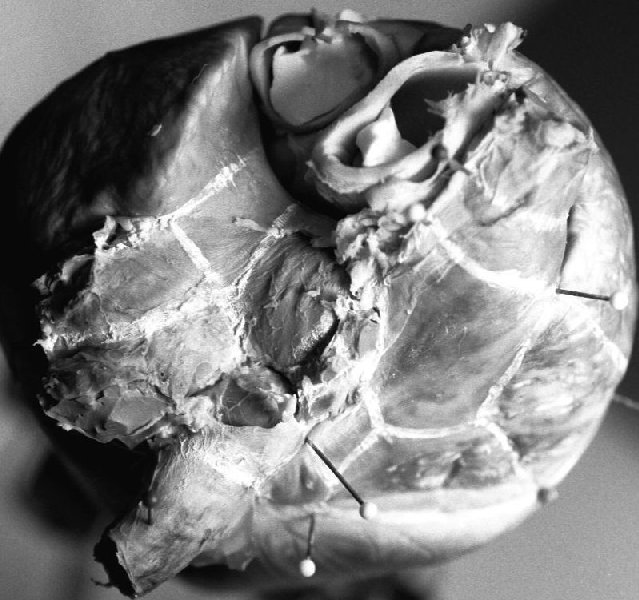
2. The 3-D surface model was created by
digitizing the epicardial surface with the measurement arm. Therefore,
different surface areas were defined on the heart by marking boundary lines
on the epicardium, see Figure 2. Node points
were recorded along these boundaries. Through an interface, the measured
coordinates were transferred to a CAD
 |
 |
| (a) |
(b) |
Figure 2. Fixed pig heart with marked boundary lines. (a)
Boundary lines on the atria. (b) Boundary lines on the left ventricle.
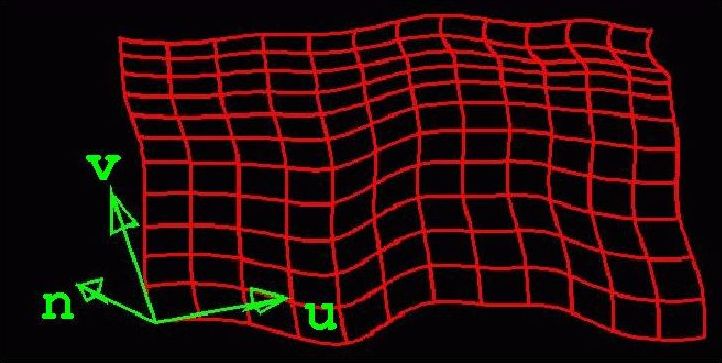
Figure 3. Parametric surface (red) represented by arrays of
bicubic patches. The u and v tangent vectors and the normal
vector n of the bottom left node point are displayed (green vectors).
software application. In the CAD software,
splines were calculated from the digitized node points and then
two-dimensional (2-D) surfaces in 3-D space were created from these splines.
The surfaces were modeled as parametric bicubic spline surfaces which are
represented by two surface parameters u and v, see
Figure 3.
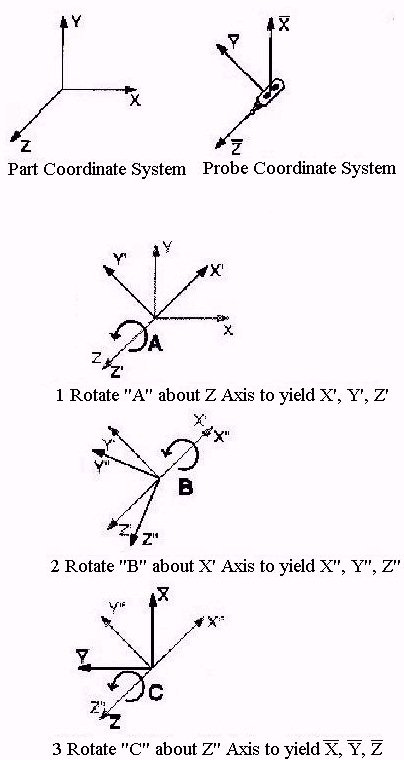
3. Fiber angles of the epicardial myocardium
were measured with the 3-D measurement arm. For a better analysis of the
fiber orientation, the epicardium and underlying fat and connective tissue
were removed first. Fiber angles of surface node points were digitized
by defining a reference position for the arm and by holding the longitudinal
axis of the probe along the surface normals of these node points. Thus,
the measured rotation angle (Euler angle)
C around the long-axis
of the probe represented the desired 2-D fiber angle

,
see
Figure 4a. Obviously, it was not possible to hold
the probes long-axis exactly along the normal vectors. By calculating the
original positions and directions of the probe and determining the directions
of the normal vector, the fiber angles were mathematically adjusted, see
Figure 4b.
 |
 |
| (a) |
(b) |
Figure 4. The rotation angles (Euler angles) of the measurement
arm. (a) Rotation angle C represents the second rotation around
the z-axis of the probe and equals the fiber angle .
(b) World Coordinate System, Probe Coordinate System and rotation angles.
Rotation angle A, represents the first rotation around the z-axis
(long-axis) of the probe. Rotation angle B represents the rotation
around the x-axis of the probe.
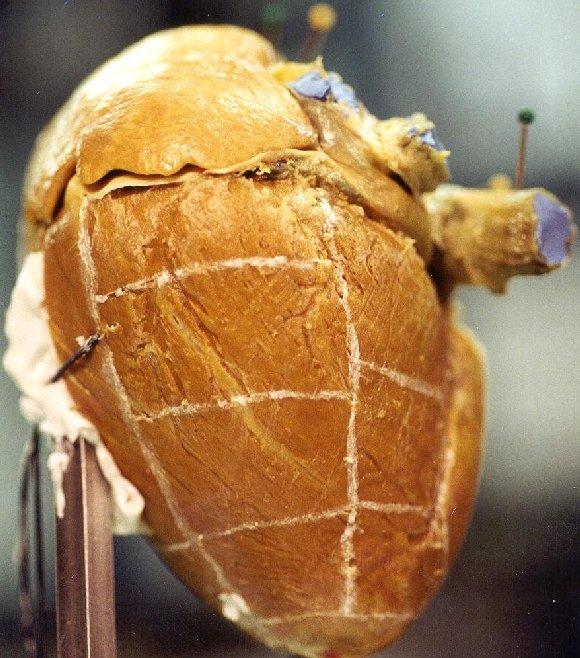
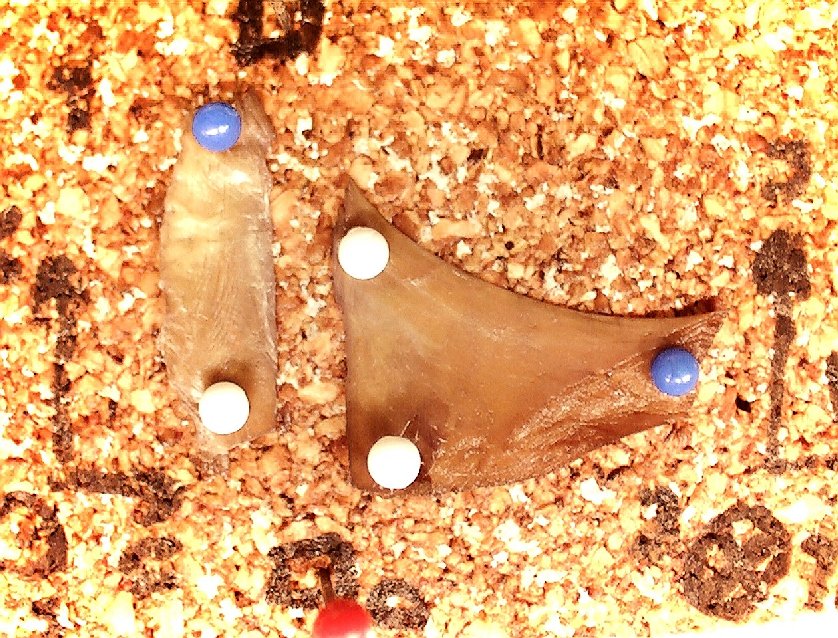
4. The heart was dissected along the marked
boundary lines. The dissected tissue sheets were pinned down on a cork
plate with the endocardial surface facing up. The u, v directions
and the normal vector of the corresponding surface and the reference line
for the succeeding endocardial fiber angle measurement were marked on the
cork, see Figure 5a. Epicardial boundaries, thickness
data and endocardial boundaries of the flat tissue sheet were digitized,
see Figure 5b. Step by step the cardiac wall was cut
down into single tissue sheets. Thus, inner cardiac structures became accessible.
These were digitized, then surfaces were created and were added to the
3-D surface model and fiber angles were measured. Then, the structures
were dissected and wall thickness was acquired in the same way as described
above. High resolution pictures were taken from every tissue sheet.
 |
 |
| (a) |
(b) |
Figure 5. (a) Dissected and pinned down tissue sheets (Eustachian
valve) on cork plate. (b) Digitized epicardial boundaries (purple) and
thickness data points (yellow). The yellow lines indicated the reference
boundaries.
5. Endocardial fiber angles of intra-atrial
surfaces that became accessible during the dissection were measured in
the same way as described for the epicardial fiber angles, see Figure
4. In this case, the endocardium was removed for a better analysis
of the fiber orientation. The endocardial fiber angles of the dissected
tissue sheets were later analyzed with the microscope after histological
preparation. To allow the transformation of these measured, 2-D fiber angles
into 3-D space, a reference boundary was defined for each tissue sheet
before dissection, see Figure 5. This boundary line
had to be straight and the cut along this line had to be in the direction
of the corresponding surface normals. Hence, the resulting values of the
2-D fiber angles do not change in reference to the reference boundary when
imported into the 3-D surface model. The properties of this boundary in
the surface model are known.
6. Dissection was simulated for the 3-D
surface model in the computer. The surface creation program was used to
unwrap 3-D surfaces into flat panels developed from the 3-D surfaces, see
Figure
6. Every surface area in the model corresponded to an epicardial surface
of a tissue sheet. Hence, every developed unwrap panel represented the
flat epicardial surface of a dissected tissue sheet.
Figure 6. Different views of a surface grid (yellow) and the corresponding
unwrap panel (green) with normal vector (red).
7. The measured data from the pinned
down tissue sheets was registered back to the 3-D surface model. First,
the acquired 2-D data sets of the sheets were imported into the data set
of the model. Then, these were placed in position by matching their normal
vectors and epicardial boundaries with those of the corresponding unwrap
panels. Thus, a consistent data set that includes all acquired data was
created, see Figure 7.
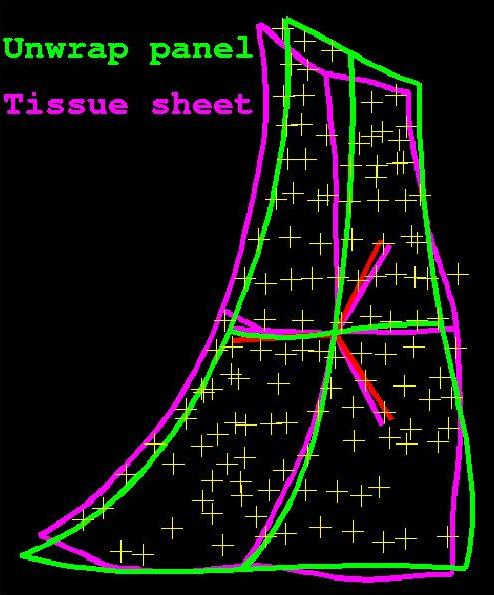
Figure 7. Tissue sheet boundaries (purple)and normal vector (red)
and thickness data (green points) matched with the corresponding unwrap
panel (yellow).
8. Specific tissue sheets containing nodal
tissue were analyzed to determine the location of the sinoatrial (SA) node
and the atrioventricular (AV) node. The terminal crest was split up where
the location of the SA node was assumed. The adjacent tissue pieces to
the cross sections were prepared for histological analysis [16],
[17], [18], [19],
[15].The tissue pieces were sectioned in slices
15 microns thick, stained with the Masson's trichrome method and then analyzed
with the microscope. The same procedure was later applied to tissue containing
the AV node.
Results
A total of 70 digitizing sessions were
performed to acquire data. Eleven sessions were needed to create the 3-D
epicardial surface model of the pig heart. One session was used to digitize
additional atrial dissection lines to represent the appendages with smaller
3-D surfaces. 13 sessions were used to digitize the epicardial fiber angles.
15 sessions were needed to add boundary or dissection lines of structures
that became accessible after dissection. 23 sessions were needed to digitize
the epicardial boundaries, endocardial structures and the wall thickness
data of the dissected tissue sheets.
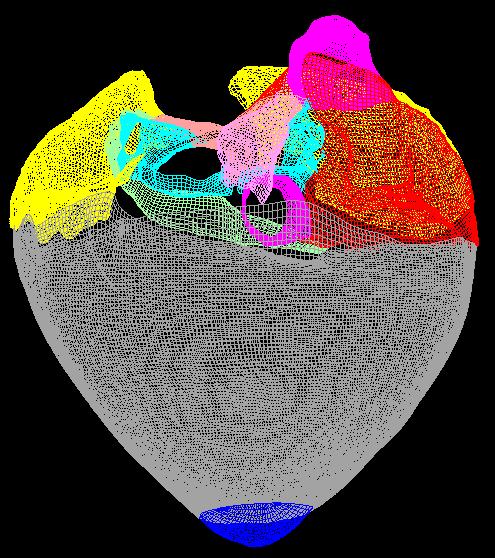
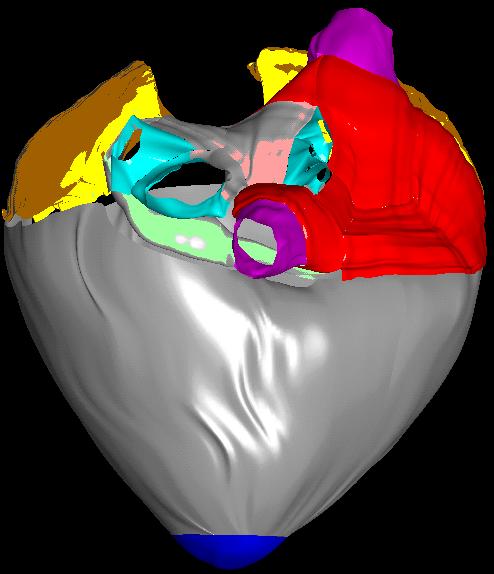
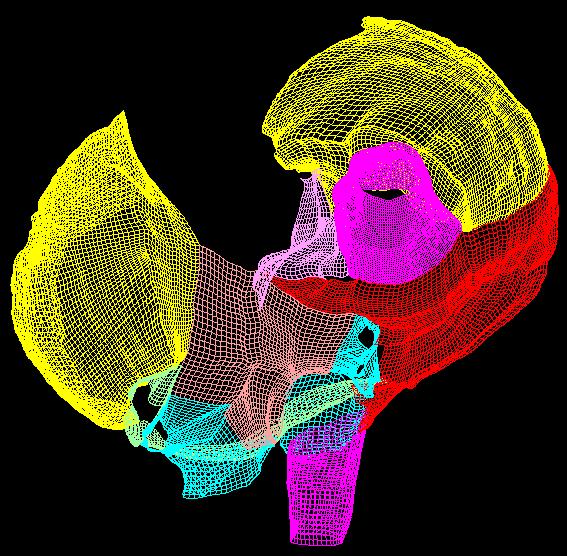
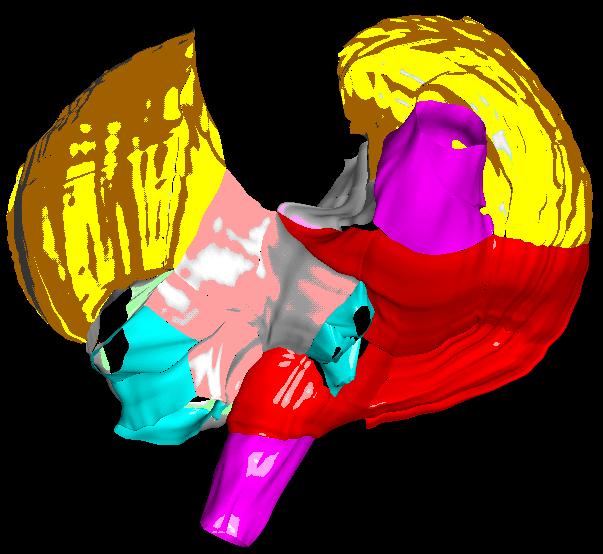
Epicardial Surface Model
A total of 112 3-D surfaces were created. 95 of these were used to create
the complete anatomical model of the pig heart. 67 from the 95 surfaces
represented the complete 3-D epicardial surface model of the specimen,
see Figure 9. The atrial epicardial surface
and accessory vessels were represented by 47 of these surfaces, see Figure
10. 24 represented the epicardium of the right atrium, 19 represented
the epicardium of the left atrium and 4 represented the left azygous vein
and the coronary sinus. The ventricles could be represented by only 2 surfaces
(ventricles and apex) or divided in several smaller surface areas. The
complete right ventricle was divided in 8 surface areas, see Figure
11b. The posterior part of the left ventricle was also divided in 8
surfaces, see
Figure 11a. Inner right and
left atrial and septal surfaces were represented by 27 surfaces. One surface
represented the inner wall of the coronary sinus.
 |
 |
| (a) |
(b) |
Figure 9. Final 3-D epicardial surface model. (a) The created
surfaces are represented by their u and v flowlines what
results in a surface grid. (b) The created surfaces were rendered. The
surfaces are displayed in different colors for a better differentiation.
The colors were randomly picked. Right atrium (red), left atrium (light
red), right and left atrial appendage (yellow), vena cavae (purple), pulmonary
veins (light blue), coronary sinus and left azygous vein (light green),
ventricles (grey), apex (blue).
 |
 |
| (a) |
(b) |
Figure 10. Created atrial epicardial surface model. (a) Surface
grids. (b) Rendered surfaces. Right atrium (red), left atrium (light red),
right and left atrial appendage (yellow), vena cavae (purple), pulmonary
veins (light blue), coronary sinus and left azygous vein (light green).
 |
 |
| (a) |
(b) |
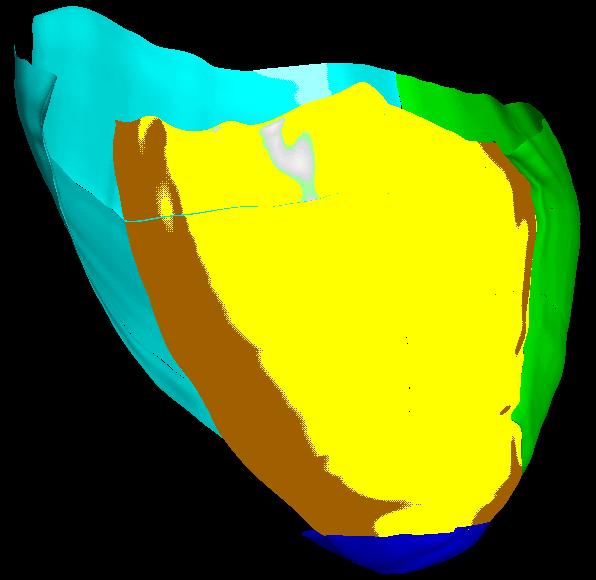
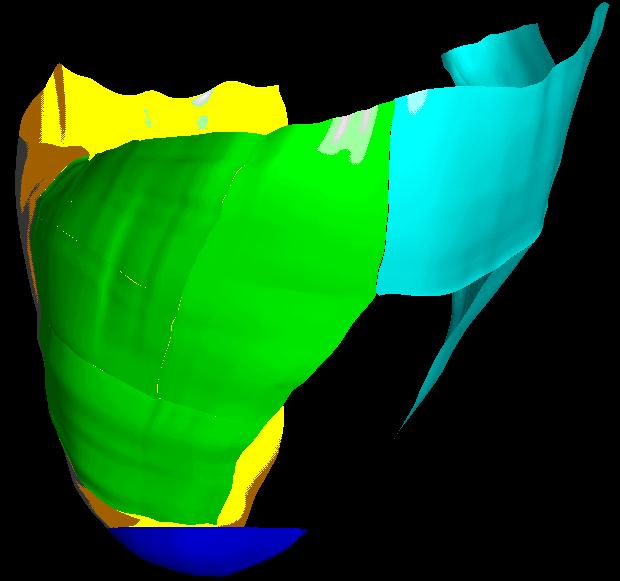
Figure 11. Subdivided right and left ventricular surface. (a)
Left ventricular surfaces (blue). The posterior and lateral part of the
left ventricle was subdivided into 8 smaller surfaces. (b) Right ventricular
surfaces (green and white). The posterior and lateral part of the right
ventricle (green) was subdivided into 8 smaller surfaces. The anterior
part (white) was subdivided into 3 smaller surfaces.
Fiber Angles
Fiber angles were imported into the surface model and then projected
onto the corresponding surface along the surface normals. In the following
, the atrial and ventricular surface areas are displayed together with
the corresponding original fiber angle points. A total of 6711 fiber angles
were digitized during this project. In the following, the distribution
of the digitized fiber angles is listed. 525 fiber angles for left atrial
appendage (LAA), 1023 fiber angles for right atrial appendage(RAA), 922
fiber angles for right atrium (RA), SVC and IVC, 647 fiber angles for left
atrium (LA) and left pulmonary vein (lPV), 439 fiber angles for right atrial
wall under right PV, 106 fiber angles for Eustachian valve (EV) (see
Figure 12), 448 fiber angles for region of and around triangle of Koch, 303
fiber angles for vestibular ring of RA, 650 fiber angles for vestibular
ring of LA, 245 fiber angles for inner left atrial walls attached
to left azygous vein (LAZV) and coronary sinus (CS), 235 fiber angles for
anterior right ventricle (RV), 254 fiber angles for anterior and lateral
RV, 299 fiber angles for posterior RV, 576 fiber angles for posterior left
ventricle (LV).
Thickness Data
Thickness data and endocardial structures were digitized for every dissected
tissue sheet that had a corresponding 3-D surface in the model. As described
in section, the points were collected all over the endocardial surface
in no special order. Endocardial pathways and structures were digitized
as 3-D polylines. A total of 7461 thickness data points of the atrial
cardiac wall were digitized during this project. In the following, the
distribution of the thickness data points over the atrial surface is listed.
1092 thickness data point for left atrial appendage, 928 thickness
data points for right atrial appendage, 3478 thickness data points for
complete right atrium, 1052 thickness data points for right atrial wall,
470 thickness data points for SVC, 298 thickness data points for
IVC, 116 and 87 thickness data points for Eustachian valve, see Figure
13, 185 thickness data points for right atrial wall under right PV,
267 thickness data points for region of and around triangle of Koch,
172 thickness data points for vestibular ring of RA, 1613 thickness data
points for complete left atrium, 321 thickness data points for left
atrial wall, 369 and 119 thickness data points for left PV and LAZV,
246 thickness data points for wall of right PV attached to the RA,
411 thickness data points for vestibular ring of LA, 97 and 89 thickness
data points for interatrial septum and left atrial wall covering the coronary
sinus, 253 thickness data points for complete coronary sinus, 153
thickness data points for posterior and free vascular wall of coronary
sinus, 100 thickness data points for vascular wall of coronary sinus attached
to LA wall.
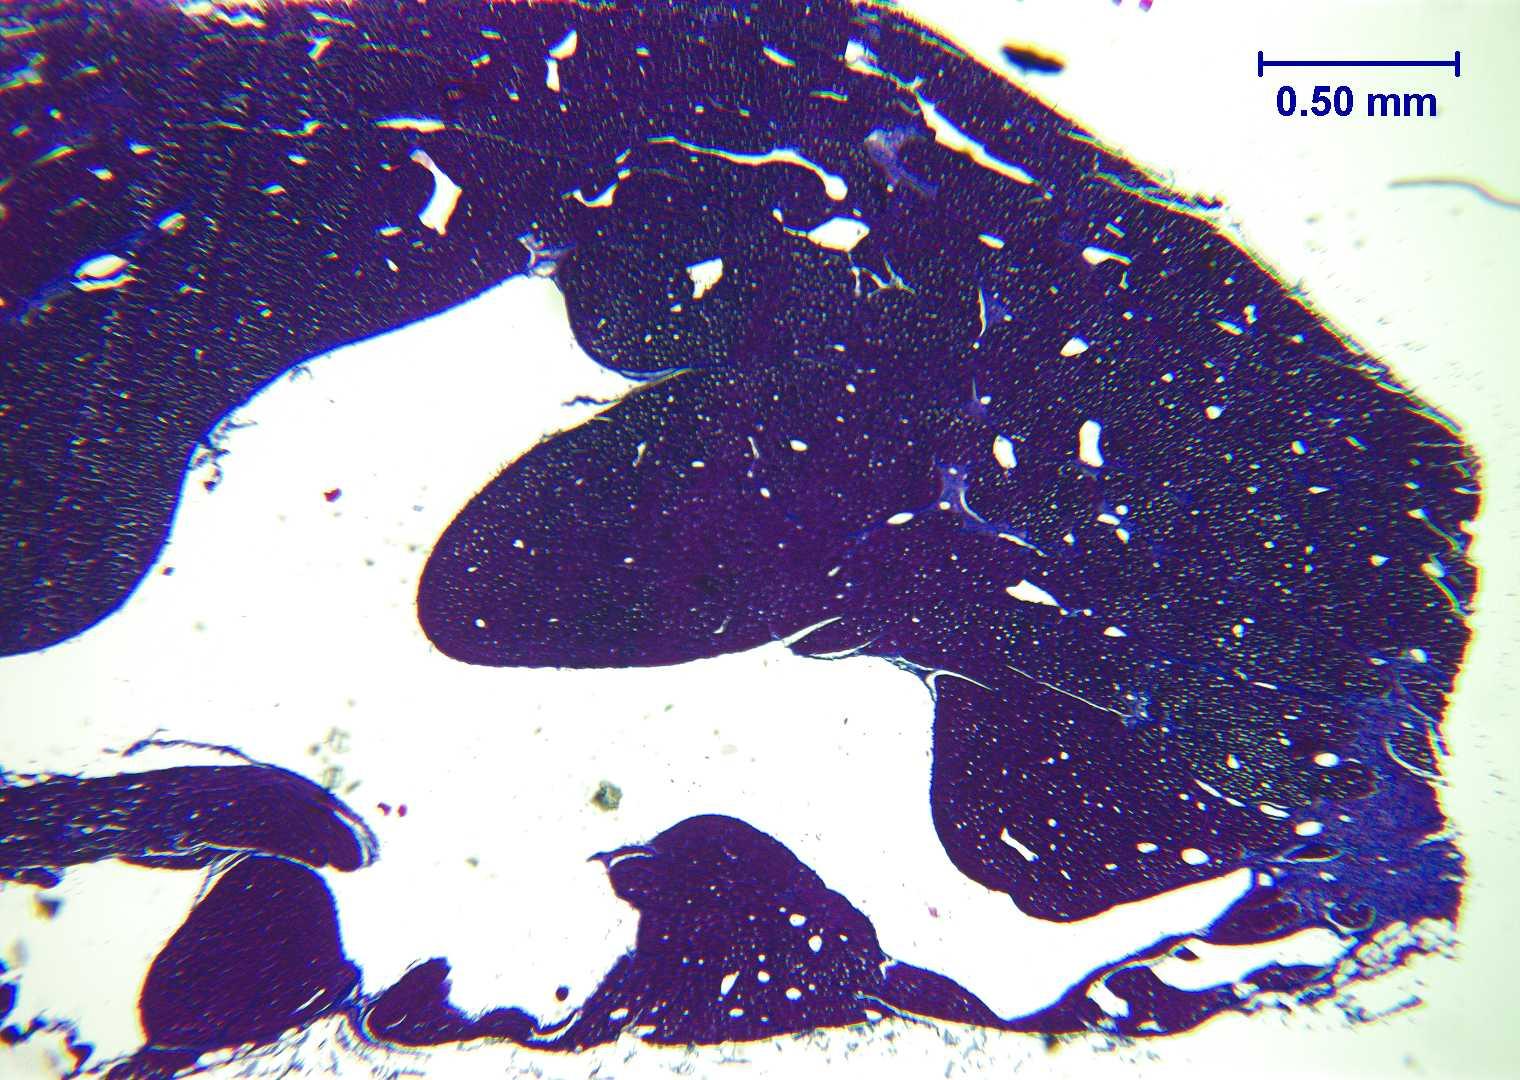
Nodal Tissue
Nodal tissue of the sinoatrial (SA) node or sinus node could be determined
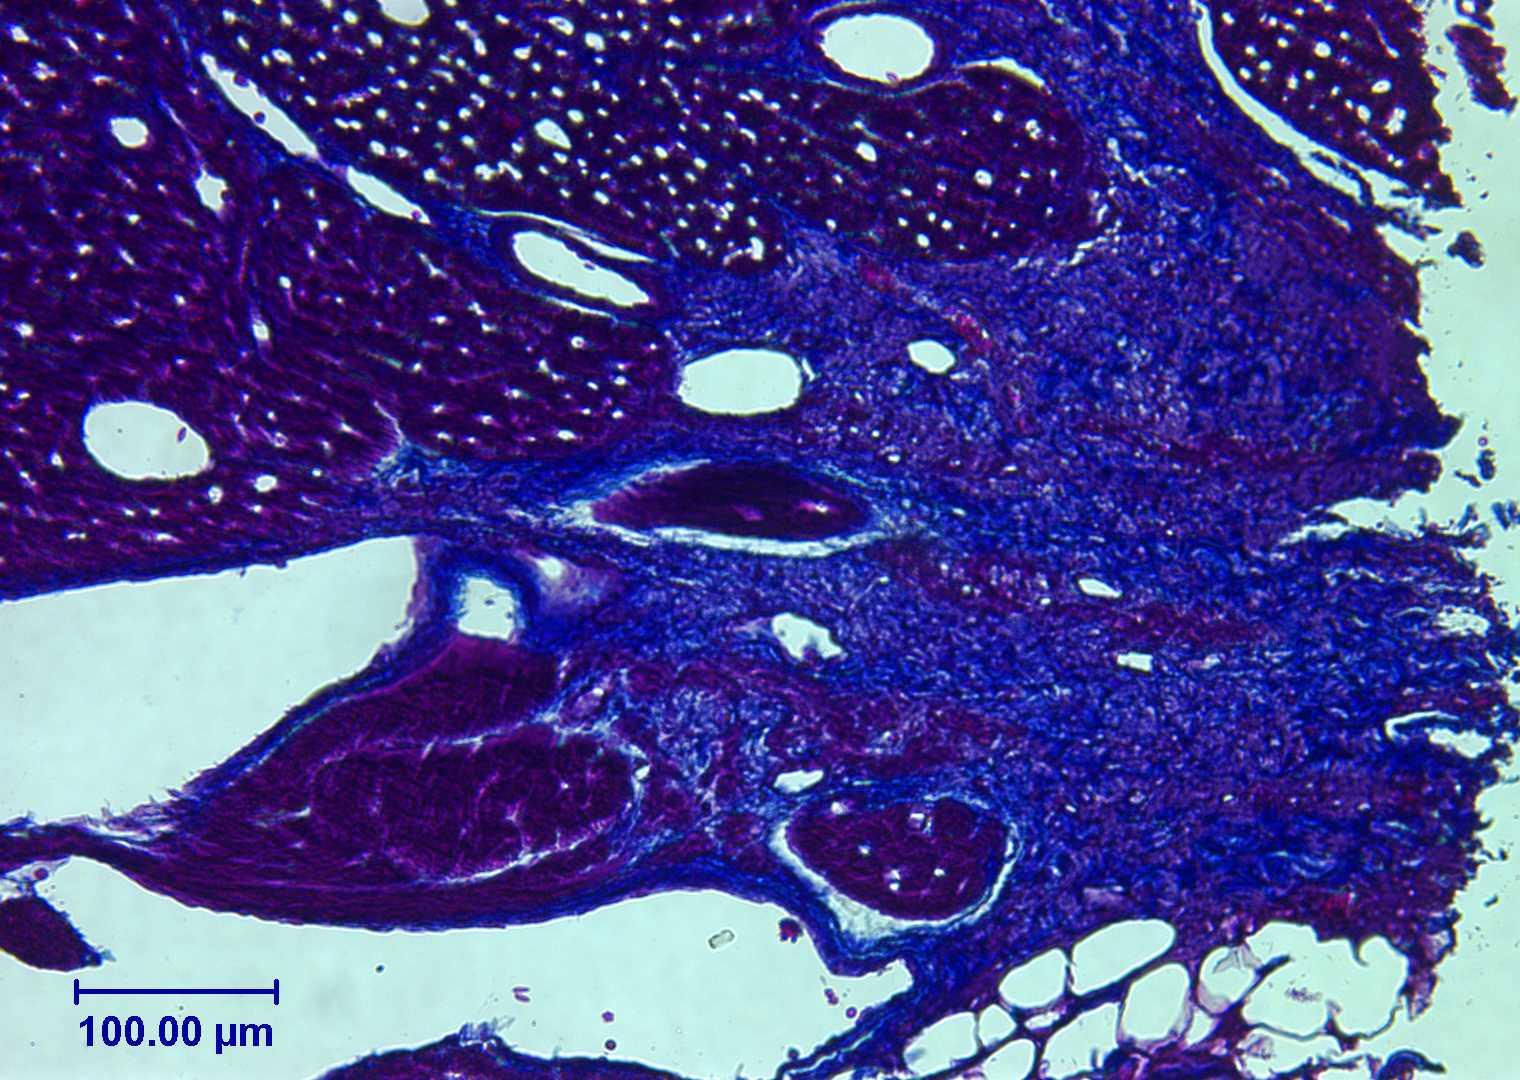
in the terminal crest, see Figure 14. More difficult
was the detection the atrioventricular nodal tissue in the atrial tissue
of the triangle of Koch. Nevertheless, tissue was detected that had similar
properties to nodal tissue, see Figure 15.
Figure 12. Digitized epicardial fiber angle node points (yellow)
of the Eustachian valve (EV) with the corresponding surfaces (gray).
 |
 |
| (a) |
(b) |
Figure 13. Digitized thickness data of the Eustachian
valve and also of an adjacent part of the IVC. (a) Overview of the distribution
of the digitized node points over the corresponding flat surfaces. (b)
Overview of the distances of the node points from the corresponding flat
surfaces.
 |
 |
| (a) |
(b) |
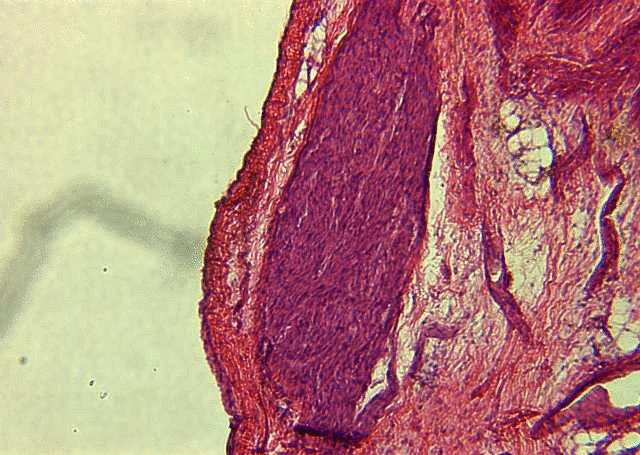
Figure 14. Stained tissue slice representing a cross section
of the terminal crest. The Masson's trichrome staining method was used.
Collagen is blue, muscle fibers are violet, nuclei are black. a) 4x Magnification.
b) 20x Magnification.
Figure 15. Stained tissue slice representing a section of the triangle
of Koch. The hematoxylin and eosin staining method was used. Muscles are
red, collagen is violet. 10x Magnification.
Conclusions
Advantages
Because the heart was perfusion fixed in-situ, non-physiological
deformations of the heart could be reduced, see section Animal
and Tissue Preparation. The pericardium was left intact during the
perfusion fixation and also during excision. This gave additional stability
to preserve the heart's shape, so that neither atrial chamber would collapse
or deform.
The advantage of this project over the creation of a 3-D surface model
from section images from an MRI or CT scan of an explanted heart, was that
the specimen could be analyzed from any given view. Hence, complex and
small cardiac structures could be analyzed more specifically and at higher
spatial resolution. Cardiac muscle fibers could be visually analyzed after
cleaning the specimen from fat and connective tissue. The tissue could
be histologically analyzed to get detailed information about inner myocardial
structures and tissue, about muscle fiber orientations and even cardiac
innervation. Using the 3-D epicardial surface model as a reference, the
histological data set could be registered back to the heart.
The average precision of the created surface model is substantially
better then one millimeter. This value is superior to achievable resolutions
of clinical CT scans and clinical MRI images [20].
Disadvantages and Limitations
The digitizing procedure and the creation of the 3-D surface model was
accomplished in about a week. The digitizing time of one or two days is
long in comparison to a single MRT or CT scan.
Using the method described in this thesis, the epicardial surface model
must be created first before any endocardial information can be acquired.
Therefore tissue must be dissected to get access to inner atrial features.
Every dissection causes indeterminate deformations in the remaining mounted
tissue.
Not determinable errors occurred during the measurements and during
editing the data set and creating the surfaces. The largest source of variation
is the accuracy of the operator. A compromise must be made between the
effort for the digitizing procedure and the achievable precision of the
digitized data.
Perspectives
To complete the atrial anatomical data set, the histological analysis must
be completed. Myocardial fiber orientations throughout the atrial wall
must be measured and registered back to the dissected tissue sheets. Also,
the nerve fiber distribution in the atrial tissue should be detected and
imported to the 3-D surface model [6], [7],
[8]. To include information on cardiac material
properties, the percentage of collagen in the tissue should be determined.
After the histological data is acquired, the data set must be reassembled
into 3-D shape.
The reassembled atrial data set could be used to create a finite element
model. This would facilitate incorporating the data into existing mechanical,
electrical or electromechanical cardiac models. Using the finite element
program, Continuity, developed at UCSD, progress is already being
made converting the model and measurements described in this thesis into
a new finite element model.
The refined techniques could be applied to a human heart. When applying
this project to a human heart, the perfusion fixation in-vivo would not
be applicable. Instead, the human heart would be isolated from a donated
dead body that is usually more than two days old. The heart would be in
a rigid state and the vessels and chambers would contain blood clots and
fibrin. Therefore, the heart must be dilated under hydrostatic pressure
and rinsed with tap water to remove these blood clots and fibrin [21],
[22].
Subsequently, the heart must be perfusion fixed for several hours with
10% or 20% formalin or glutaraldehyde. Depending on the thickness of its
ventricular walls, the heart remains immersed for one or more days in 10%
buffered formalin, where it can also be stored before further processing
[21], [22]. Preparation,
casting and mounting could applied in a similar way as for the pig heart.
Conclusion
The pig is an important experimental model of human atrial and ventricular
pathologies including atrial arrhythmias which are becoming increasingly
prevalent, especially among elderly patients. Therefore, the current detailed
anatomic measurements and the created model have the potential to be useful
for providing an improved understanding of the anatomic basis of these
disorders in humans. However, ultimately the present analysis should be
repeated for human atria from healthy and diseased hearts. The experiences
gained in the present project should make this undertaking more feasible,
efficient, and accurate.
Acknowledgements
The authers wish to acknowledge Dr. James W. Covell for the use of his
laboratory and Rish Pavelec and Troy for excellent surgical and technical
support. We thank An Pham, Steffen Ritter, Anne Gebert and Ilka Lorenzen
for support and help during the measurements.
References
[1] Crick, S.J., Sheppard, M.N., Ho, S.Y., Gebstein
L. and Anderson, R.H., "Anatomy of the pig heart: comparisons with normal
human cardiac structure", Journal of Anatomy, vol. 193, pp. 105-119, 1998.
[2] Wang, K., Ho, S.Y., Gibson, D.G. and Anderson,
R.H., "Architecture of atrial musculature in humans", British Heart Journal,
vol. 73, pp. 559-565, 1995.
[3] Wilcox, B.R. and Anderson, R.H., "Surgical
Anatomy of the Heart", Raven Press, New York, ISBN 0-88167-103-7, 1985.
[4] Becker, A.E. and Anderson, R.H., "Pathology
of Congenital Heart Disease", Butterworth, London, Boston, Sydney, ISBN
0-407-00137-9, 1981.
[5] Papez, J. W., "Heart musculature of the
atria", The American Journal of Anatomy, vol. 27, no. 3, pp. 255-285,
1959.
[6] Bharati, S., Huang, S.K.S., Parr, G.V.S.,
Bauernfeind, R. and Lev, M., "The conduction system of the swine", Chest,
vol. 100, pp. 207-12, 1991.
[7] Crick, S.J., Sheppard, M.N., Ho S.Y.
and Anderson, R.H., "Localisation and quantitation autonomic innervation
in the porcine heart I: conduction system", Journal of Anatomy, vol. 195,
pp. 341-357, 1999.
[8] Bojsen-Moller, F. and Tranum-Jensen,
J., "Whole-mount demonstration of cholinesterase-containing nerves in the
right atrial wall, nodal tissue, and atrioventricular bundle of the pig
heart", Journal of Anatomy, vol. 108, no. 3, pp. 375-386, 1971.
[9] Anderson, R.H. and Ho, S.Y., "The architecture
of the sinus node, the atrioventricular conduction axis, and the internodal
atrial myocardium", Journal of Cardiovascular Electrophysiology,
vol. 9, pp. 1233-1248, 1998.
[10] Taylor, J. R. and Taylor, A. J., "The relationship
between the sinus node and the right atrial appendage", Canadian Journal
of Cardiology, vol. 13, no. 1, pp. 85-92, 1997.
[11] Sanchez-Quintana, D., Davies, D.W., Ho, S.Y.,
Oslizlok P. and Anderson, R.H., "Architecture of the atrial musculature
in and around the triangle of Koch", Journal of Cardiovascular Electrophysiology,
vol. 8, pp. 1396-1407, 1996.
[12] Cabrera, J.A., Sanchez-Quintana, D., Ho,
S.Y., Medina A. and Anderson, R.H., "The architecture of the atrial musculature
between the orifice of the inferior caval vein and the triscuspid valve:
the anatomy of the isthmus", Journal of Cardiovascular Electrophysiology,
vol. 9, pp. 1186-1195, 1998.
[13] Stone, H.L. and Sawyer, D.C., "Cardiac
output and related measurements in unanesthetized miniature swine", Swine
in Biomedical Research, L.K. Bustad, R.O. McClellan, Richland, Washington:
Batelle Memorial Institute, Pacific Nothwest Laboratory, pp. 411-418, 1966.
[14] Engelhardt, W., "Swine cardiovascular
physiology - a review", Swine in Biomedical Research, L.K. Bustad,
R.O. McClellan, Richland, Washington: Batelle Memorial Institute,
pp. 307-329}, Pacific Nothwest Laboratory, 1966.
[15] Smith, A., Yen Ho, S. and Anderson,
R.H., "Histological study of the cardiac conducting system as a routine
procedure", Medical Laboratory Siences, vol. 34, pp. 223-229, 1977.
[16] Bancroft, J.D. and Pearse, A.G.E., "An introduction to histochemical
technique", Butterworth, London, 1, 1967.
[17] Gurr, E., "Staining, practical and theoretical",
The Williams and Wilkins Co., Baltimore, 1, 1962.
[18] Bancroft, J.D. and Stevens, A., "Theory
and practice of histological techniques", Churchill Livingstone, New York,
Edinburgh, London, Madrid, Melbourne, 4, ISBN 0-443-04760-X, 1996.
[19] Bancroft, J.D. and Pearse, A.G.E.,
"An introduction to histochemical technique", Butterworth, London, 1, 1967.
[20] Morneburg, H., "Bildgebende Systeme für
die medizinische Diagnostik", PUBLICIS MCD, München, 3, ISBN 3-89578-002-2,
1995.
[21] Tiedemann, K. and von Hagens, G., "The
technique of heart plastination", Anatomical Record, vol. 204, no. 3, pp.
295-299, 1982.
[22] von Hagens, G., Tiedemann, K. and Kriz,
W., "The current potential of plastination, anatomy and embryology", vol.
175, no. 4, pp. 411-421, 1986.

 Home
Current Issue
Table of Contents
Home
Current Issue
Table of Contents